
“How can you manage risk without understanding risk appetite?” asked Chris Mandel, SVP Strategic Solutions at Sedgwick, Inc. He was the first of two presenters at the webinar “Aligning Risk Appetite with ERM Governance” sponsored by the Global Association of Risk Professionals on March 17, 2015.
“Some people ask why do I have to go through a bureaucratic exercise,” Mandel said, pointing out that there are real advantages to developing a risk appetite framework (RAF). Risk appetite management is expected more and more often by regulators, credit rating agencies, institutional investors, and internal auditors.
“Missing the connection between risk and success can be fatal,” he stressed, noting that, in the post mortem of the most recent financial crisis, the Senior Supervisors’ Group called for banks to have a clearly defined risk appetite and monitor risk with reference to it in a better fashion.
“An effective RAF requires strong internal relationships,” with a common risk appetite language. The Board of Directors of an organization must recognize that success depends on the effective management of key risks.
Mandel clarified the terms risk appetite, risk tolerance, and risk limits. Risk appetite is the total exposure that an organization is willing to gamble for risk-return trade-off. Risk tolerance is the amount of uncertainty the organization is prepared to accept in total, by business unit, or by risk category. Risk limits are more granular versions of risk tolerance.
Mandel posed the question: “do some risks matter more than others?” He cited the 2010 findings of the Corporate Executive Board which found that 68 percent of the time, declines of 50% or more within a 12 month period, strategic risk was the root cause of value destruction.
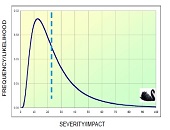
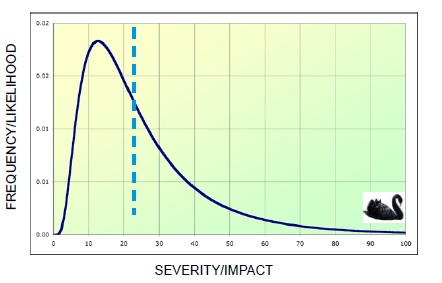
Strategic risk is notoriously difficult to quantify. Mandel displayed the standard frequency versus severity plot (see Figure 1). Most often risks of low severity but high frequency are managed. He challenged the audience to choose a risk range focus that was “to the right of the expected loss line because the severity could include complete destruction of the company.”
“Strategic risks are those internal or external uncertainties, whether event or trend driven, which typically have the biggest impact an organization’s strategies,” Mandel noted, and they often tie into the processes of key products or services.
Mandel recommended a blended approach to measuring key risks, which are comprised of quantitative (e.g. growth targets, earnings volatility, liquidity position) and qualitative (reputation, culture, health & safety) elements.
Figure 2 shows the hierarchy, with risk capacity at the very top of the organization, from which risk appetite is chosen, and risk tolerance is set… all the way down to risk limits at the process level.

Mandel pointed out that multiple appetites and tolerances, depending on the business unit often exist. Heat maps are a concise way to summarize progress in key performance areas. He emphasized that the “key to effectively using risk appetite strategies/frameworks is to tie the risk indicators to things that define success and failure.” These key risk indicators (KRIs) are crucial, because they “identify risk exposure levels, and can detect changes or trends in existing risk exposures” and can reveal emerging risks. The level of a given KRI is tracked over time, and when its level exceeds the risk threshold, management should be alerted to take action.
After the fact, the key performance indicators (KPIs) will help “gauge the results” of whatever was or wasn’t done. Ultimately, the organization must link risk indicators to performance metrics to enhance the chances of delivering the mission.
Mandel summarized: “an organization’s ability to take risk is a function of its financial strength while its willingness is a function of tolerance for uncertainty.” ª
Click here to view the webinar presentation Aligning Risk Appetite with ERM Governance. Chris Mandel’s slides go from 5 to 31.
Click here to read about the second presentation.
Figures are used with permission from Chris Mandel’s slides.