According to the World Economic Forum, “personal data is becoming a new economic asset class, a valuable resource for the 21st century that will touch all aspects of society.” The New York Times likens big data to a resource like crude oil. What, then will extract the useful component from the raw data? What reaction vessel will synthesize new things from the raw data? Cray, the supercomputer company, has a spin-off data manipulation company, Yarcdata, that specializes in graph analytics.
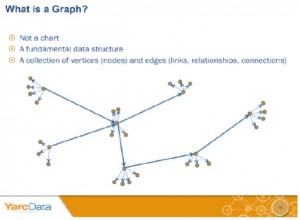
Graph analytics refers to models of complex networks of data in a graphical representation of nodes and edges. “Analysis of nodes and edges can provide information on relationships in the data,” said Peyman Mestchian, Managing Partner at Chartis Research during a webinar sponsored by Yarcdata.com on September 18, 2013.
There is a pressing need for graph analytics in financial services, according to Mestchian. Such analysis will help the user understand current and emerging risks. He contrasted search and discovery. Search operations are scalable but discovery is difficult to scale. Search operations are limited and predictable, whereas discovery is unpredictable. Search operations are a “reactive” approach to risk management, whereas discovery involves a “proactive” approach because it analyzes the connected data points, patterns and networks.
Mestchian outlined the typical compliance environment. Too often, rigid data schemes are expensive to modify or extend, and there are too few resources allocated to perform true discovery.
Regulators have their own set of desired capabilities. Basically, they want risk managers to spend more time investigating high impact alerts rather than performing routine analyses. It should be easy to test out a new hypothesis. An inquisitive risk manager will want to draw different samples, and partition obscure patterns in the data.
The situation is muddied by increasing data complexity, and the limitations of existing technology. He pointed out there is an integration bottleneck, followed by a formatting bottleneck, an aggregation bottleneck, and then a reconciliation bottleneck.
The benefits of graph analytics, according to Mestchian, are four-fold:
- The method is oriented to relationships and connections.
- Queries can be pattern-based.
- Visualization is easy.
- Patterns are easy to detect.
In this way, the user of graph analytics software such as that available through Yarcdata can move from reactive to proactive risk management.ª
The webinar presentation can be requested from the Yarcdata website.
Disclaimer: The author does not hold stock or any interest of a monetary nature in this software.
Click here to read an earlier presentation by Peyman Mestchian on Basel III challenges to data management.


