

According to a CoreLogic survey, roughly 35 million homes, or nearly a third of the nation’s housing stock, are at “high risk” of a natural disaster. How much are U.S. households willing to pay for insurance? Will this give adequate coverage? And what do changes in demand imply for the future of insurance markets?
“Climate losses are increasing, with homeowners insurance premiums rising in tandem,” said Pari Sastry, Assistant Professor of Finance at Columbia Business School, “and there is widespread concern that rising premiums are making insurance unaffordable.”
Parinitha Sastry was speaking at a webinar on May 15, 2025, presenting “The Limits of Insurance Demand and the Growing Protection Gap,” an article she co-authored with Tess Scharlemann, Principal Economist at the Federal Reserve Board, Ishita Sen, Assistant Professor of Finance at Harvard Business School, and Ana-Maria Tenekedjieva, Senior Economist at the Federal Reserve Board. Sastry’s presentation was sponsored by the Center for Economic and Policy Research (CEPR).
 The researchers asked what determines households’ willingness to pay for insurance—and what are the implications for the market. There are two competing theories: unconstrained versus financially unconstrained. In the unconstrained case, households will continue to increase household debt in order to finance the insurance required. In the constrained case, they do not exhibit an ever-increasing willingness to pay; they do not increase their debt load and thus many end up underinsured.
Why haven’t these questions been looked at before? “It is lack of data, not lack of interest,” Sastry said. They had access to “novel nationwide micro data” that contained homeowner insurance and debt for the period 2013-2023.
In their paper, they describe how they had to “construct a novel comprehensive dataset that combines information, at the loan level, on homeowners insurance, mortgage contracts, borrower characteristics, property characteristics, and climate risk from 2013-2022 for households across the U.S.”
“We start by using a first-of-its-kind dataset from ICE McDash,” they write, and further details may be found therein. Intercontinental Exchange (ICE) is an American multinational financial services company and McDash is their trademarked dataset.
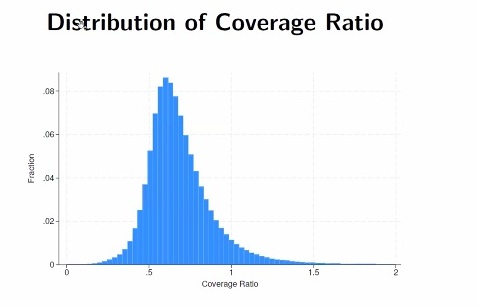
Sastry and co-authors found the average American household only holds insurance to provide 70 percent of the replacement cost, as shown in the distribution below.
The researchers had to contend with “heterogeneous rate regulation across the U.S. states. In “low friction” states, insurers could freely adjust prices. In “high friction” states, there is limited adjustment in response to changing risks, demand, or credit conditions. They included a friction parameter in their model.
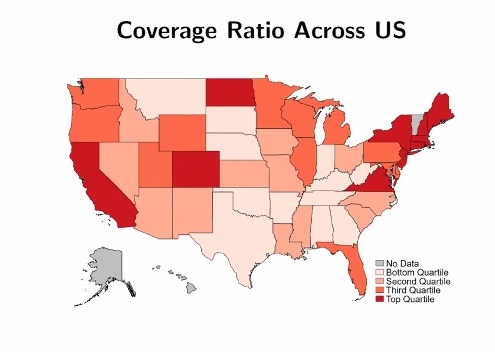
Coverage can be sorted into four categories: very high—medium high—medium low—very low. If each quartile is assigned a color such as dark red for the top coverage, the following map can be drawn by state. Note the top insured states are California, New England, North Dakota and Colorado.
The researchers used a theoretical framework that combined standard models with models of financial constraint. This had three parameters of interest: the elasticity of demand for insurance coverage with respect to insurance price, and then two cross-price elasticities.
Sastry and co-researchers found “pervasive underinsurance,” mostly among the most financially vulnerable households.
Even with insurance premiums at break-even cost (“actuarially fair”), they found “households’ willingness to pay is below expected losses.” Demand remained elastic, a result “inconsistent with the textbook models of insurance demand.” Taken to its logical conclusion, their work suggests that the market for HO insurance may disappear for the most constrained, financially vulnerable households.

The results by Sastry and co-authors suggest that insurance markets may shrink even more as losses from natural disasters rise. ♠️