

Many countries signed on to the 2016 Paris Agreement, but nine years later, how many are actively working toward decarbonization? Watchdog organizations are evaluating the progress made year over year and will encourage the 195 or so signing parties to keep the commitments they made.
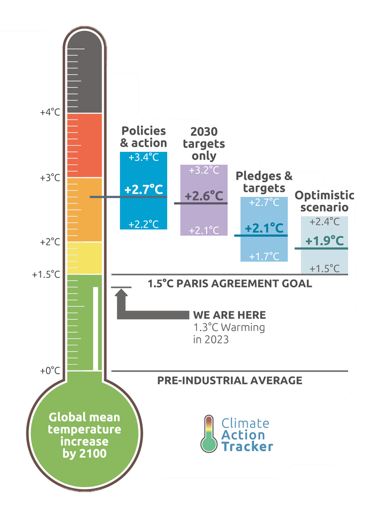
One such organization is the independent scientific project Climate Action Tracker (CAT), whose main graphic summarizes the goals.
On May 21, 2025, the Climate Action Tracker group presented a webinar, “Plugging Into Progress: Evaluating Power Sector Decarbonization,” in which four experts on climate risk discussed the progress, or lack thereof. Louise Jeffrey began the session. [Photo on far left.]

“It’s a challenging time in a distracting geopolitical environment,” said Seth Monteith from Climate Works Foundation, an organization that connects philanthropy and climate change. [Second photo from left.] “Details are extremely important at the sectoral level,” he said. “Besides power, there are also industry and building sectors that contribute to climate change.”
At the 2023 United Nations Climate Change Conference held in Dubai, also referred to as COP 28, the signatory governments agreed to two big goals by the year 2030:
- They would triple their global renewable capacity; and
- They would double their energy efficiency.
“Decarbonizing the power sector is the cornerstone to decarbonizing the global economy,” said Gustavo De Vivero, of Climate Action Tracker. [Second photo from right.] He pointed out that the power sector is the largest emitting sector, and renewable energy power generation is already a reality that is cost-competitive with the fossil fuel methods.
“What is behind tripling the target for renewable energy?” he asked. “Renewable powered installations have grown exponentially in the last decade. There have been technological developments. And lots of modularity. Wind and solar are the main technologies being installed. The share of renewables continues to grow year by year, led mainly by wind and solar.”
“But we are still far from where we need to be by 2030,” De Vivero cautioned. “Also, we need to have the acceleration more evenly distributed across nations.” He showed charts comparing capacity additions for China, the U.S., Europe, and the rest of the world. (See below for China and U.S.)
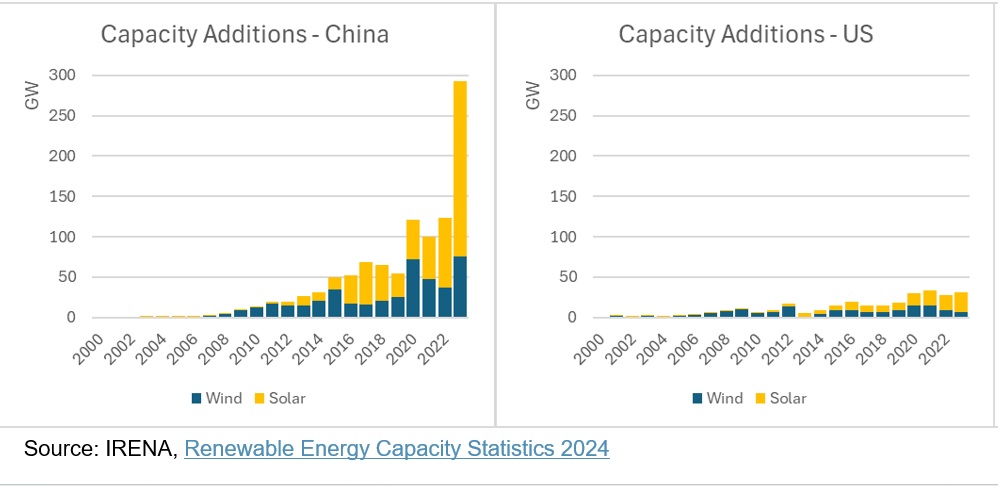
China leads the pack on both solar energy and wind. In 2023, they generated 300 gigawatts (GW) of power through renewable energy. [Editor’s Note: The Hoover Dam generates about 2 GW of power.]
As any project manager knows, when faced with a big goal, break it down to manageable chunks. De Vivero said, “We need to translate the global tripling goal down to the national level with country-level indicators.” These are called nationally determined contributions (NDCs). The NDCs are at the core of the Paris Agreement, and they reflect the goals of each country to reduce national emissions and adapt to the impacts of climate change.
As an example, he compared the approach to NDC levels for U.S. versus Saudi Arabia, which has a very small renewable energy component.
New interim goals have been set for 2035. “The new NDCs should be ambitious, fair, credible, and transparent,” he said. As of 2024, twenty countries had signed on.
“Our method is focused on including multiple analytical elements,” he noted. “Overlapping multiple lines of evidence provide more robust benchmarks.”
“The benchmarks should not be interpreted in isolation.” Much depends on the country policy landscape. “In general, we fall short,” he noted.
“We need to identify where things are not going so well so that action and resources can be directed there,” said Sarah Heck, of Climate Action Tracker. [Photo on far right.] CAT evaluated the power sector for 16 countries.
She compared progress in Switzerland (“decarbonized”), Brazil (“making headway”), India (“slow progress”) and Saudi Arabia (“barely moving”). More detailed power sector evaluations can be found at the link below.
Much work has been done, but much work remains to be done. ♠️
Click here to view the CAT summary of June 2025.
A helpful rule of thumb when reading about large amounts of energy: The U.S. DOE estimates the Hoover Dam generates about 2 GW of power.
Click here to view the webinar “Plugging into progress: Evaluating power sector decarbonisation for 1.5°C.”
Click here to find out more about the CAT power sector analysis.
Click here to dive into the data with the CAT Data Explorer.