
Are changes in inflation being driven by transitory shocks that will die out quickly? Or by persistent shocks that will cause structural change within the economy?
An example of a transitory shock is the supply chain bottlenecks that occurred during and shortly after the Covid pandemic. (Remember the ship that got hung up in the Suez Canal, causing a huge traffic jam?) An example of a persistent shock is the 1973 oil crisis and related geopolitical conflicts in the Middle East.
Economists want to pinpoint what kind of inflationary pressure is currently brewing so that the national treasury—in the U.S., the Federal Reserve Board—can respond in a timely way to restore price stability, chiefly through adjusting monetary policy.
But how to distinguish between transitory and persistent shocks?

Two economists have designed a new index that should answer that question. The Inflation Shock Momentum Index (ISMI) is based on tracking persistence, namely, whether shocks continue to move in the same direction, month over month.
The lead author is Kevin Lansing, senior research advisor, Economic Research Department of the Federal Reserve Bank of San Francisco (FRBSF). His co-author, Adam Shapiro, is vice president, also at the FRBSF.
They write, “Inflation can stay high or low for two reasons: (1) The underlying inflation trend is slow to change, or (2) the underlying shocks can be long lasting.”
The ISMI approach delivers two benefits relative to existing indicators of inflation. First, it distinguishes between upward versus downward inflation pressure, rather than simply gauging overall persistence. Second, it employs only recent data.
“The ISMI tracks whether category-level inflation shocks have been consistently positive or negative in recent months,” they write. “A sustained sequence of same-signed inflation shocks can indicate that the underlying inflation process is shifting.”
Method
Personal consumption expenditures (PCE) measure the price of goods and services targeted towards individuals and consumed by individuals, everything from diapers to preparing taxes. The PCE basket of goods and services is divided into nine main categories: Food and beverages, housing, apparel, medical care, transportation, education and communication, recreation, tobacco, and other goods and services.
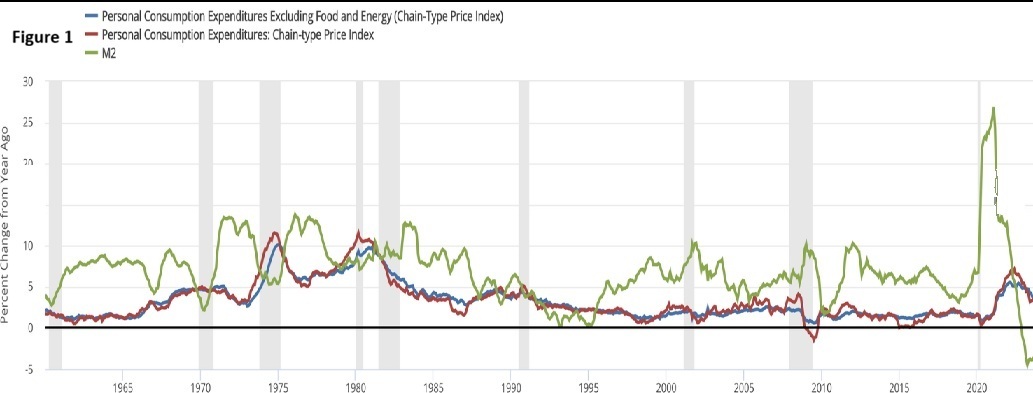
Figure 1 shows the PCE Index [red, blue] and the M2 money supply over time [green], below, shows peaks around 1975, 1980, and 2022.
The researchers sorted each category of the PCE basket into groups based on the pattern of recent monthly surprises, called inflation shocks.
(a) Positive momentum categories had three consecutive positive inflation shocks,
(b) Negative momentum categories had three consecutive negative inflation shocks.
(c) Mixed categories did not have three consecutive and were not used
The ISMI represents the expenditure-weighted share of inflation categories with positive momentum minus the share with negative momentum.
Figure 2 shows the new ISMS [jagged blue line] relative to the PCE index [green]. The authors note, “The index is persistently positive during the Great Inflation era of the late 1970s and early 1980s. It then turns sharply negative during the subsequent disinflation and remains below zero into the 1990s.”
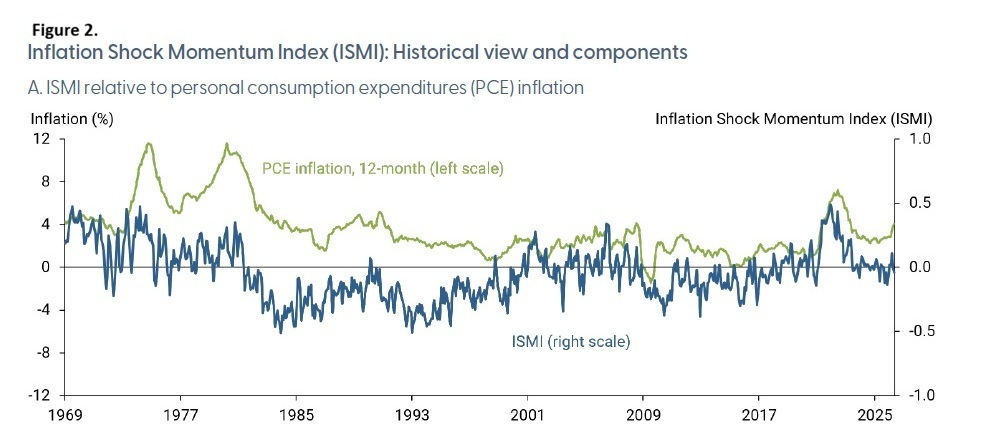
Long-run inflation expectations became tethered to the Federal Reserve’s longer-term inflation goal, and from 2001 onward, the ISMI has fluctuated around zero, except for the pandemic blip. They write, “The ISMI then declines sharply with the onset of the Great Recession in late 2007 and remains mostly negative during the 2010s, coinciding with a period of persistently low inflation.”
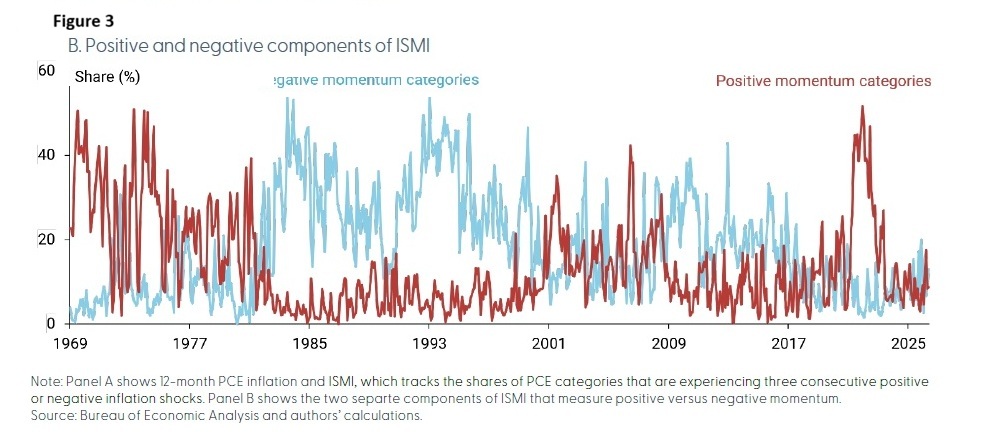
Figure 3 shows “the positive and negative components of ISMI remain close to each other during the early to mid-2000s, translating to an index value that fluctuates around zero. This pattern.”
To test the index, they test the response of ISMI to macroeconomic shocks, as described in the Economic Letter (link given below).
Findings
Lansing and Shapiro give a thumbs-up to their proposed new index, which “offers a practical tool to detect emerging shifts in the underlying inflation environment.”
As for present-day inflation predictions? They conclude, “Index readings in 2026 have been fluctuating above and below zero, indicating that inflation may remain near current elevated levels in the near to medium term.” ♠️
FRBSF Economic Letter: Click here to read “Using Inflation Shock Patterns to Help Forecast Inflation” by Kevin Lansing and Adam Shapiro.
Figure 1 is from Wikipedia – By FRED – https://fred.stlouisfed.org/graph/?g=NHl3Liberationreport.com, Public Domain, https://commons.wikimedia.org/w/index.php?curid=113218839
Figures 2 and 3 are derived from the Economic Letter. Permission pending.
The thumbnail photo is by Markus Winkler on Unsplash.