
The potential for burning grows every month under climate change, as drought conditions increase in frequency and intensity. The dangers change unevenly, country by country and region by region. Ultimately, the operational risk of wildfires adds to country risk.
But how bad is the current situation? Has anyone tried to benchmark, or systematically quantify, the events and the damages? An effort to benchmark the state of destruction has begun in a climate centre in England, the Tyndall Centre for Climate Change Research at the University of East Anglia in Britain.

The findings of an expert panel were released in the inaugural report, “State of Wildfires 2023–2024,” and published in the peer-reviewed journal Earth System Science Data on August 14, 2024. The report analyzes extreme events from the March 2023 to February 2024 fire season worldwide. Matthew Jones is the lead author of the report and a research fellow at the Tyndall Centre.
The State of Wildfires report represents their inaugural effort to “catalogue extreme wildfire events, explain their occurrence, and predict future risks.”
The news from the first report is sobering. “Global fire carbon emissions were increased by record emissions in Canadian boreal forests at over 9 times the average,” they write. The boreal forest is a biome characterized by coniferous forests.
The report analyzed events including:
- The record-breaking fire extent and emissions in Canada,
- the largest recorded wildfire in the European Union (Greece),
- the drought-driven fires in western Amazonia and northern parts of South America,
- the deadly fires in Hawaii (100 deaths) and
- the deadly fires in Chile (131 deaths).
In the 2023–2024 fire season, 3.9 million square kilometers burned globally. [As a point of comparison, the landmass of the entire country of India is about 3.3 million square kilometers.]
Fire carbon emissions were 16 percent above average, totalling 2.4 Pg C. [Note on units: a Petagram of carbon (Pg), also known as a Gigaton (Gt), is equal to 10^15 grams or one billion tonnes. A tonne, also known as a metric ton, is equal to one thousand kilograms (1,000 kg).]
“Over 232 000 people were evacuated in Canada alone,” the report says, “highlighting the severity of human impact. Our analyses revealed that multiple drivers were needed to cause areas of extreme fire activity.”
“In Canada and Greece, a combination of high fire weather and an abundance of dry fuels increased the probability of fires, whereas burned area anomalies were weaker in regions with lower fuel loads and higher direct suppression, particularly in Canada.” A “burned area anomaly” is a statistical term based on thermal comparisons of unburned and burned regions.
Those who live in an area often have little warning. “Fire weather prediction in Canada showed a mild anomalous signal 1 to 2 months in advance, whereas events in Greece and Amazonia had shorter predictability horizons.”
Jones said that the report authors attempted to assess the causes of these events and found a strong link to climate change and land use. They went on to forecast future risks under different climate scenarios.
“The probability of extreme fire seasons of these magnitudes has increased significantly due to anthropogenic climate change,” the report states, “with a 2.9–3.6-fold increase in likelihood of high fire weather in Canada and a 20.0–28.5-fold increase in Amazonia.”
The authors created this first annual report for a reason. “By consolidating state-of-the-art wildfire science and delivering key insights relevant to policymakers, disaster management services, firefighting agencies, and land managers, we aim to enhance society’s resilience to wildfires and promote advances in preparedness, mitigation, and adaptation.”♠️
Click here to read the Earth System Science Data article this posting is based on.
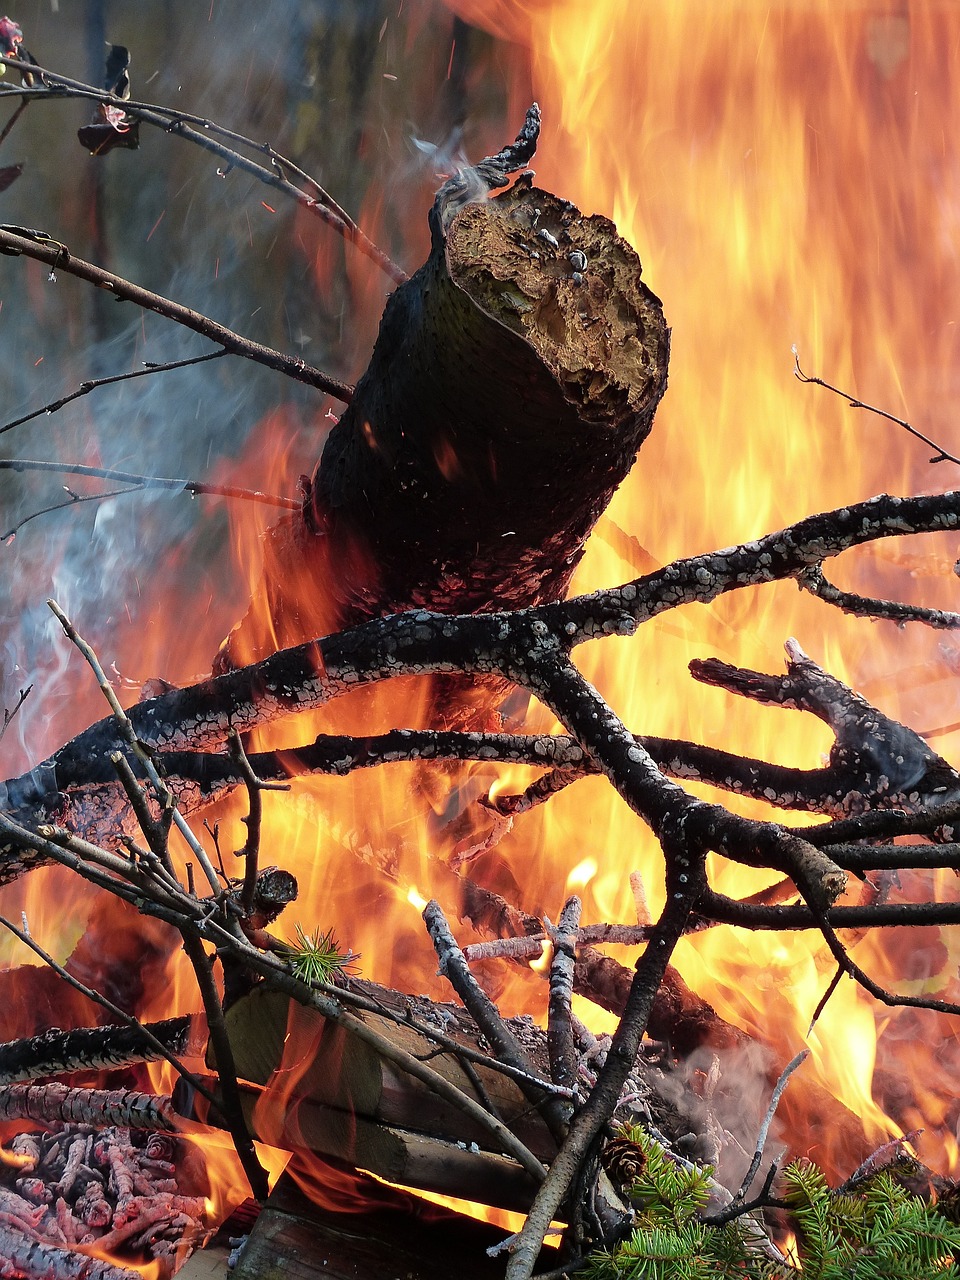
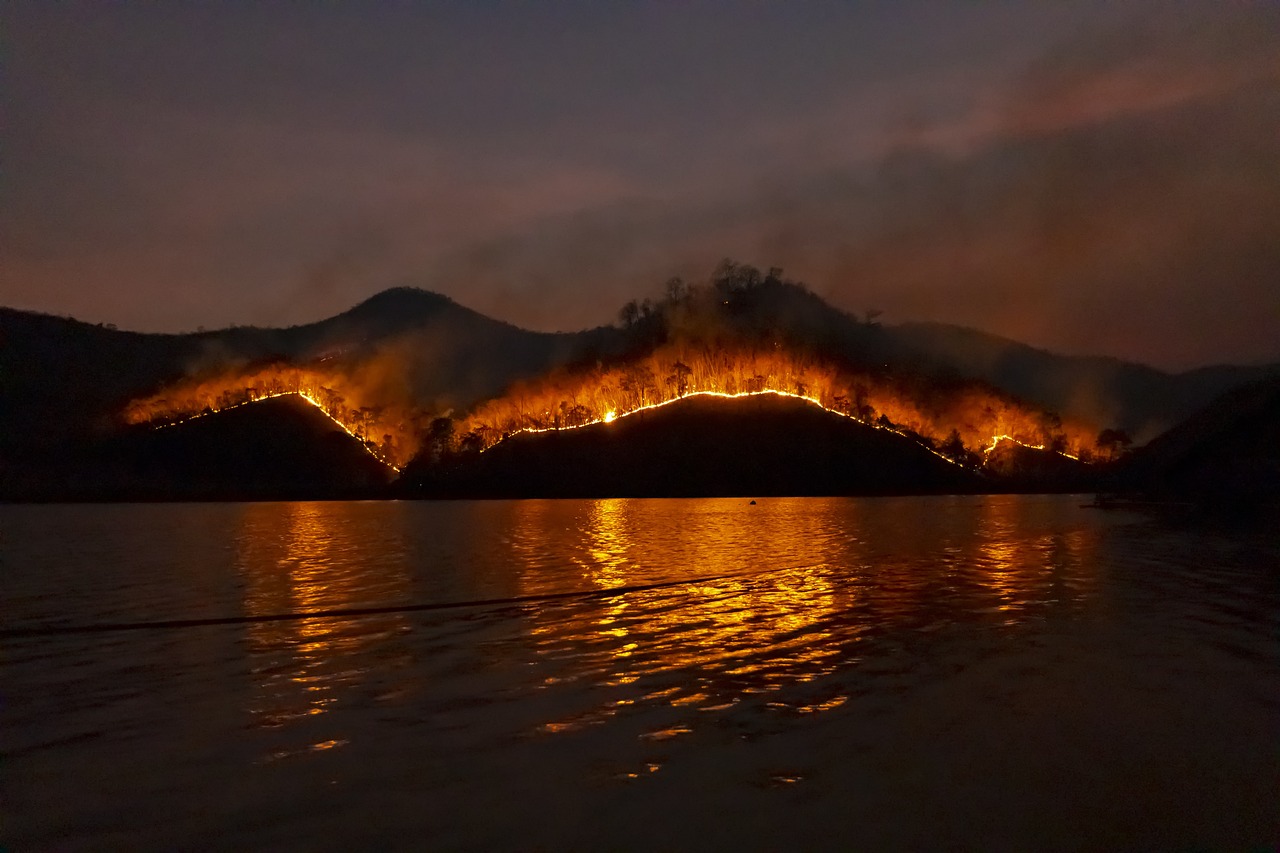
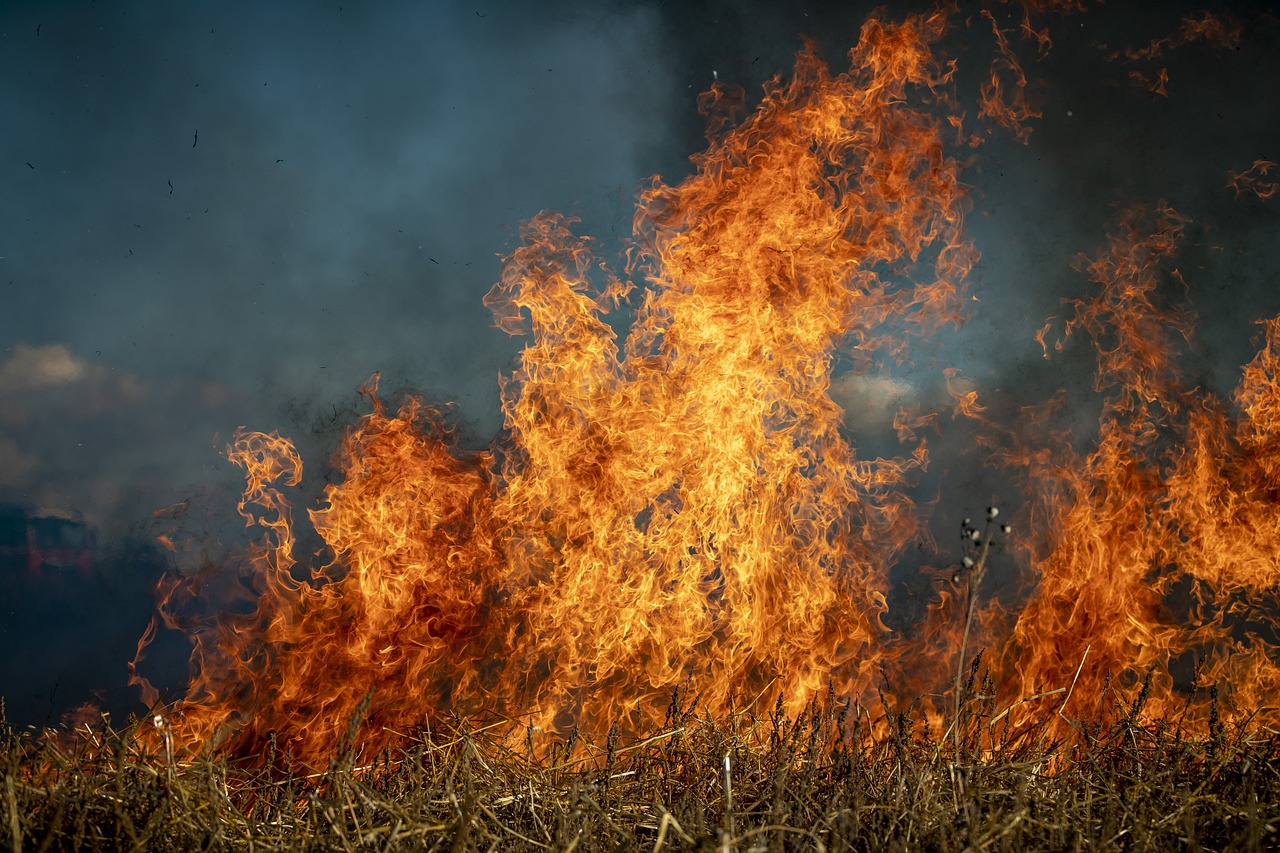
The wildfire visuals are from the royalty-free section of Pixabay.com.
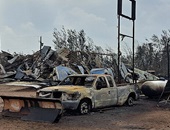
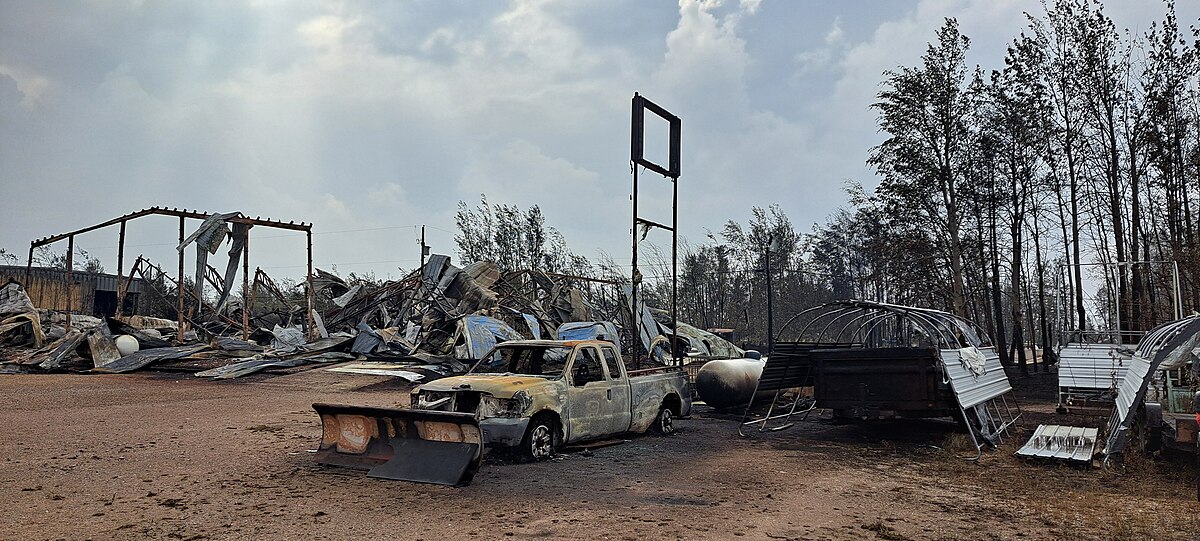
The thumbnail image for this post (a burned-out truck) and the last image are from Jeffery J. Nichols, CC BY-SA 4.0, via Wikimedia Commons.