

How can software systematize and optimize the routine tasks in building financial risk models?
“We use topology to inform feature selection, and then we examine a range of models,” said Mukund Ramachandran, Data Scientist at Ayasdi. He was the third of three panellists at the October 27, 2015, webinar on Effective Risk Models Using Machine Intelligence sponsored by the Global Association of Risk Professionals.
In the course of evaluating potential models, several statistical tests are applied. “Machine intelligence considers the entire high dimensional space jointly,” he said. Machine learning is capable of applying hundreds of algorithms and different combinations, “but we look at models that exhibit high fidelity within the structural map.”
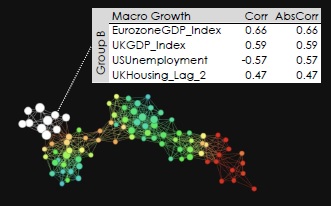
Machine intelligence can be used to discover topological links between variables. Software can build a “map of similarities” which can then be colour-coded to represent an outcome of interest. In the example he showed, red indicated a high correlation of an economic variable with business revenue; blue indicated a low correlation. (See portion of screen capture below.)

The dots on the map tended to cluster together in “coherent groups” applicable to a certain line of business. For example, the Macroeconomic Growth group included variables such as the Eurozone GDP index, the UK GDP index, US unemployment, and UK housing lagged by two quarters. Topological analysis showed these formed an identifiable group within the larger pool of variables.
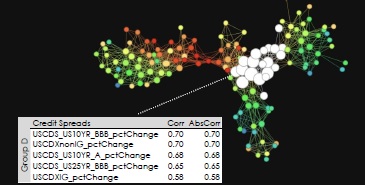
Another identifiable group, the credit default swap (CDS) group, contained the US ten-year BBB CDS, the US ten-year single-A CDS, and additional CDS indices.
Ramachandran explained that, once the topological networks group the data according to similarities, then the business owner, who is seeking to construct a financial model, could select subsets from each group to use as representative members for that group.
For one example, he chose as initial selections: ten-year US Treasury yield; BBB Corporate yield; and nominal GDP growth. Only one feature at most from each group will appear in the model; this avoids the problem of overfitting the data.
Machine learning was used to test each combination of input parameters. The models were ranked by cross-validation testing to select the top performers. For a fixed-income trading desk, ultimately the best model contained BBB Corporate yield and the Japanese GDP growth. The second-best model contained UK GDP growth and the ten-year US Treasury yield.
“It’s a highly scalable platform, and can be customized for different banks, which have different desired outcomes,” Ramachandran said. Although such a technique is dependent on historical data, “we capture nuanced properties … and we’ve had good success with historical factors.” ª
Click here to read about the first presentation.
Click here to read about the second presentation.
Figures in this posting appeared in the presentation and were used with permission from Ayasdi.