
Stuart Kozola, product manager for computational finance at MathWorks, demonstrated examples of trading systems using MATLAB during a webinar on August 21, 2012. In the first half he discussed how to develop an automated trading decision engine. This meant identifying a successful trading rule, extending the trading rule set, and automating the trading rule selection. In the second half of the webinar he showed implementation of the automated trading, with a caveat that these would require testing prior to integration and execution in the real-life scenario.
The worked problem involved Brent oil futures. The first challenge was to identify profitable trading strategies. The decision engine contained models and trading rules. In Kozola’s demo of a live streaming system, he entered a quote to buy via a “Banzai table” that depends on Reuters playback. It outputs price history from incoming data. He used X-Trader to receive orders. This contains order logs to be updated with new working orders. These were real-time event-based feeds.
The trading engine has certain requirements: sophisticated analytics, scalable speed, high frequency capability (i.e., “intra day”), and it should be quick to develop and deploy. For the webinar’s purposes, Kozola chose a genetic algorithm approach. The dataset of daily oil prices for Brent contained data, volume, open, close, high and low prices.
Kozola automatically converted data types on importing the Excel data file, and he used the movavg() function to generate moving averages. Some averages were leading, some lagging. As an example rule, he specified that “when signal (price) for leading is above lagging, then buy.” At this point the Sharpe ratio would also be calculated. [The prepared script is “demo1” at the MATLAB File Exchange site for this seminar (URL below).]
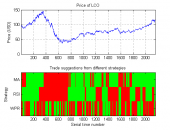
In “demo4,” Kozola took this one step further. He showed how to find the best trading rule and maximize the Sharpe ratio using a genetic
algorithm. In the first pair of screen shots here, the top panel shows the price of a commodity. In the red/green panel, the choice made by the genetic algorithm is shown, with the raw data first having been massaged by one of three techniques: MA =moving average, RSI = relative strength index, WPR = William’s percent range).
In the second price-decision pair, the top panel repeats the commodity price and the bottom panel shows the cumulative return for the method that gave the best Sharpe ratio.
The “demo5” script involved stepping beyond the MATLAB environment to get live price info from X-Trader. The “demo6” script involved Quick Fix Java components that would pull info from the “Banzai table,” make a decision to buy or sell, and then execute orders through X-Trader or Quick Fix. This concluded a successful albeit highly technical talk of how to set up automated trading using MATLAB components. ª
The webinar presentation slides can be found at: http://www.mathworks.com/company/events/webinars/index.html
The website for the downloadable code is: http://www.mathworks.com/matlabcentral/fileexchange/
The webinar recording will be available on this list (will filter down to financial services): http://www.mathworks.com/financial-services/