

Stressed Interest Rates: Battle of the Models
For generating shocked interest rate curves, such as a sudden economic stress might engender, “a three-factor parameterization solves many problems—but issues remain,” said Alexander Bogin, Senior Economist at the Federal Housing Finance Agency, and the second presenter at a webinar on modelling interest rate shocks held October 28, 2014, and sponsored by the Global Association of Risk Professionals. To develop an improved yield curve approximation, Bogin showed three variants of non-linear Laguerre functions of time to maturity. These were the Nelson-Siegel model (which has 3 factors); the Svensson model (4 factors); and the Björk-Christensen model (5 factors). Over a two-year […]

Stressed Interest Rates: ‘Simple’ Not Good Enough
“It’s difficult to apply historical down-shocks to the current low interest rate environment,” said Will Doerner, “and models have problems in the low interest rate environments of today.” Doerner is Senior Economist at the Federal Housing Finance Agency (“Agency”), and was the first presenter at a GARP webinar on how to generate historically-based interest rate shocks, which was held October 28, 2014. An accurate estimation of market risk helps financial institutions determine the amount of capital needed to withstand adverse market events. Interest rate changes represent a key factor for institutions with large fixed income portfolios. As such, when stress […]
MATLAB for Excel Users: “Discoverability”
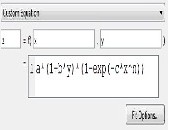
When looking for good data analysis tools, many financial professionals turn first to MS Excel which displays numeric data, contains advanced functions, and can be programmed with Visual Basic. A growing number of professionals are turning to MATLAB which has strengths complementary to ordinary spreadsheets. At a webinar on January 15, 2013, Adam Filion, application engineer at MathWorks, showed approximately three hundred audience members how easily features of MATLAB software adapt themselves to rapid analysis of large datasets. In Excel functions, the input is specified as a cell location and the math is hidden. In MATLAB, the interface has a […]
Analytical Tools to Gain Insight and Speed Up Numerical Analysis
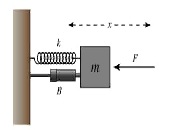
“Symbolic computing can be a practical part of the solution to your problem,” said Deepak Ramaswamy, technical marketing manager at Mathworks. On January 8, 2013 he showed about three hundred participants via webinar how they could switch between analytical tools in a Notebook app to numerical analysis of the same problem in the MATLAB interface. He stepped his way through one “classic” and two “real-life” problems: the damped oscillator model; fuel consumption of a rocket-powered car; and kinematics of a double-jointed robot arm. The three problems can be written as systems of Ordinary Differential Equations (ODEs) and this was the […]

Mining Microeconomics Using MATLAB
Modelling the economics of an iron ore mine “is a complex task that can be made more reliable,” said David Willingham to a webinar audience on December 5, 2012. Willingham, an application engineer at Mathworks, was demonstrating how a typical mine’s economics could be modelled using MATLAB and then embedded within an Excel spreadsheet. Developing a mine involves significant capital expenditures and long time frames. Willingham aimed to take the audience through a good model that would take into account the microeconomics of a particular mining company, integrated with the macroeconomic environment, such as interest rates and iron ore prices. […]
Develop & Deploy Financial Models
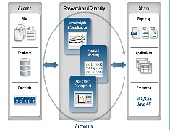
“Focus on modelling, not programming,” urged Ameya Deoras, senior applications engineer at MathWorks. He was speaking during a webinar on December 3, 2012 about the use of MATLAB in the construction of financial models. Deoras’ talk covered four examples to varying depth during the hour. The first example, the calculation of the efficient frontier for large-cap stocks, allowed him to show the easy data importation from an ODBC-compliant database. Each step of the way he showed how the input could be visualized with a single click. If the data exist in a relational database (think tables and fields such as […]
Automated Trading with MATLAB
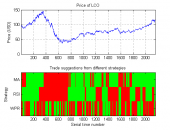
Stuart Kozola, product manager for computational finance at MathWorks, demonstrated examples of trading systems using MATLAB during a webinar on August 21, 2012. In the first half he discussed how to develop an automated trading decision engine. This meant identifying a successful trading rule, extending the trading rule set, and automating the trading rule selection. In the second half of the webinar he showed implementation of the automated trading, with a caveat that these would require testing prior to integration and execution in the real-life scenario. The worked problem involved Brent oil futures. The first challenge was to identify profitable […]
Tree Bagger & Tree Booster: MatLab for Data-Driven Fitting
Let’s say you want to create a predictive model without assuming an analytical form to the model. How would you go about it? On August 14, 2012, Richard Willey, Technical Marketing Manager at MathWorks, demonstrated via webinar how input data could be fit using machine-learning approaches. The emphasis here is data-driven, as opposed to model-driven, fitting. “A limitation of regression techniques is that the user must specify a functional form,” said Willey, and the choice of that model is usually based on the domain model. Typically the data points are fit with high-order polynomials or Fourier series. Or, the user might run the data […]