The welcome news this summer is that the overall rate of inflation is easing up, both in the U.S., where it has dropped to its lowest level in over two years, and to a lesser extent, in Canada, where in July, Canada’s inflation rate fell to 2.8 percent. Gasoline is pulling the inflation rate down, while food and mortgages were pushing it up.
How has the U.S. housing market responded to the rise in interest rates? How do recent trends in the cost of house prices and rents affect the likelihood of future shelter inflation?
“Various market indicators, including house prices and rents, suggest that the housing market has slowed significantly with the rise in interest rates,” says a recent paper issued by three economists at the Federal Reserve Bank of San Francisco (FRBSF) who explored the inflationary pressures on the cost of shelter. On August 7, 2023, an Economic Letter was released that summarized their findings.
Based on recent mathematical modeling the study concludes that “shelter inflation is likely to slow significantly over the next 18 months, consistent with the evolving effects of interest rate hikes.” The authors were Augustus Kmetz and Schuyler Louie, who are both research associates, and John Mondragon, who is a research advisor. All three work in the Economic Research Department of the FRBSF.
 Let’s break down their study into its component questions: 1. What role does the cost of shelter play in the overall inflation rate? 2. How do different types of shelter contribute to the overall rate? 3. What is forecast for the future?
Shelter inflation is regularly tracked as part of the consumer price index (CPI), which contains “core costs” (non-perishables) and “volatile costs” (food and energy).
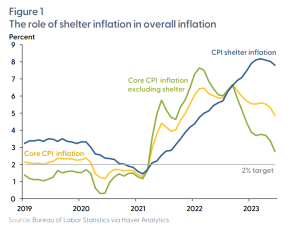
Figure 1 shows the year-over-year growth in core CPI inflation as a yellow line. If the cost of shelter is removed, the green line appears with sharp peaks appearing in mid-2021 and early 2022. Shelter inflation, shown as the blue line, does not reach a peak until early 2023—and that is at over 8 percent inflation. Shelter makes up a third of the CPI consumption basket.
The researchers wanted to know: does the “asking rent” correctly reflect the actual price of shelter? Not quite, they argue. The price of shelter is “complicated by differences in building types and geographic areas, as well as differences in methodologies used to estimate rents.”
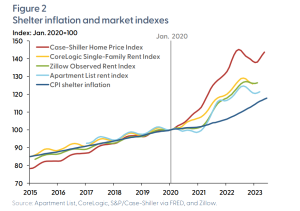
Figure 2 shows a few indexes of asking rents and house prices: the CoreLogic index, the Zillow index, and the classic Case-Shiller Home Price Index maintained by the Federal Reserve Board of St. Louis. These are shown along with CPI shelter inflation, which the authors normalized to 100 in January 2020 for ease of comparison. The rates are all rising over time. The authors found “a significant gap remains between the spot-market indexes and CPI shelter.”
To forecast the inflation rate over the next 18 months, the researchers used a dynamic statistical model. They divided geographic regions into areas called “core-based statistical areas” (CBSAs) that are cities and surrounding communities.
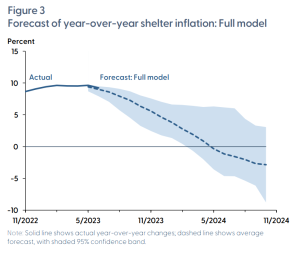
They used a disaggregated approach because they wanted greater statistical precision. Figure 3 shows a baseline forecast (blue shading shows the 95 percent confidence interval). In this “full model” case, shelter inflation is predicted to go to zero in April 2024 and then to become deflationary.
They write, “The deflationary component of this forecast would be the most severe contraction in shelter inflation since the Global Financial Crisis of 2007-09.”
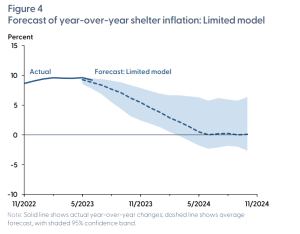
They decided to modify their model. “We drop the index that has the most negative effect on the cumulative forecast—which turns out to be lagged CPI shelter inflation” and the results for this “limited” model are shown in Figure 4. Deflation does not occur.
In both full and limited models, however, shelter inflation shows a significant correction.
Three main caveats for this study apply: the error range is large; the models use data from the pandemic era; and the forecasts do not account for any potential future shocks.
Thus, the high inflation rate of shelter costs is predicted to be a transitory situation. ♠️
Click here to read the original Economic Letter this posting summarizes.
The four graphs are from that Economic Letter; permission is pending.
The house graphics are from the Real Insights blog of the GTA-Homes website. Permission is pending.


