

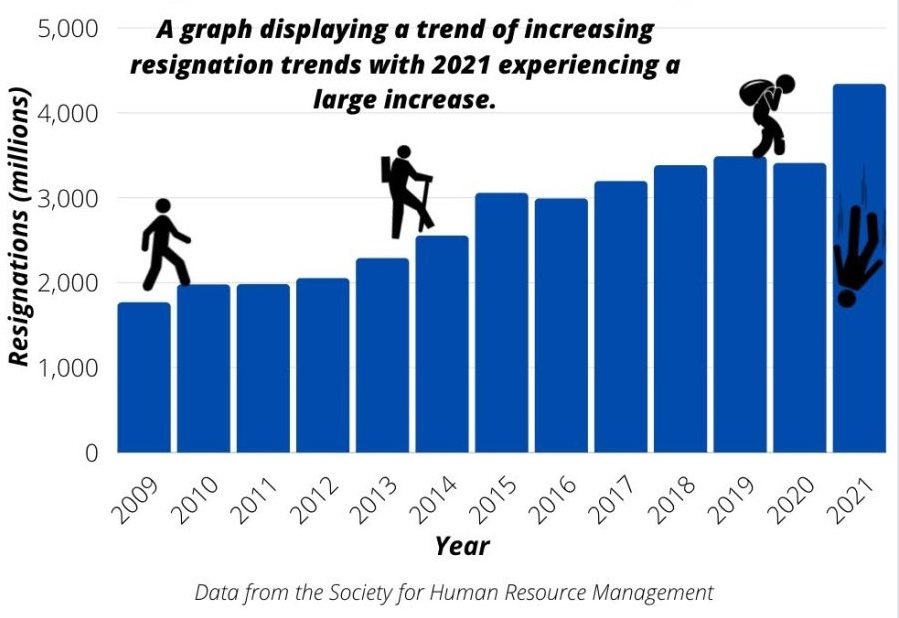
In early 2021, in the wake of the Covid-19 pandemic, the U.S. saw many workers leave their jobs and seek other employment—leading to record high job vacancies—a phenomenon observed dubbed “the great resignation.” Lately, inflation is rising, markets are cooling, and the great resignation appears to be slowing. The question becomes: How will unemployment rise as growth slows and job vacancies decline?
On August 29, 2022, the Federal Reserve Bank of San Francisco (FRBSF) released an Economic Letter titled “Finding a Soft Landing along the Beveridge Curve” that explores the current relationship between unemployment and economic growth.
The paper was a joint effort by Brandyn Bok, research associate; Nicolas Petrosky-Nadeau, vice president; Robert G. Valletta, associate director; and Mary Yilma, research associate. They all work in the Economic Research Department of the FRBSF.
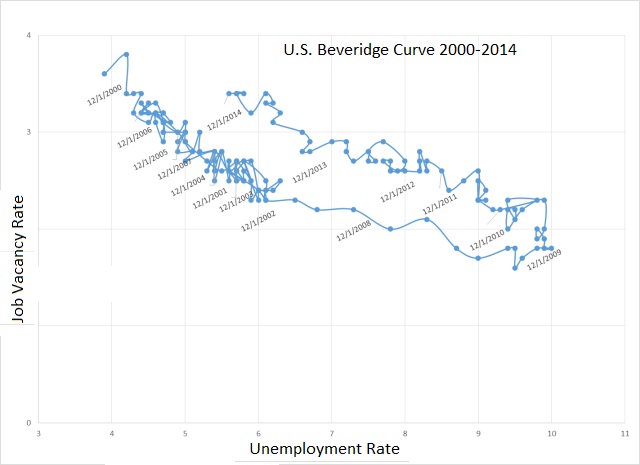
To investigate the effect of slowing growth, these four economists used a mathematical model called the Beveridge Curve. The model is fit to real-world data (see graph below) usually shown as a graph of unemployment rate, U, and job vacancies, V, and is also referred to as the U-V curve.
Logically, one expects high unemployment will cause workers to stay with their jobs (leading to low vacancy rates). Indeed, the data shows an inverse relationship exists between the two variables U and V.
The scattered data points can be fit to an analytical function that shows smooth behavior (see blue and red lines in graph below). “When the labor market is strong, with low unemployment and high vacancies,” write the authors Bok et al., “unemployment is likely to be relatively unaffected by increases in job openings. This will be reflected in the curve being quite steep.”
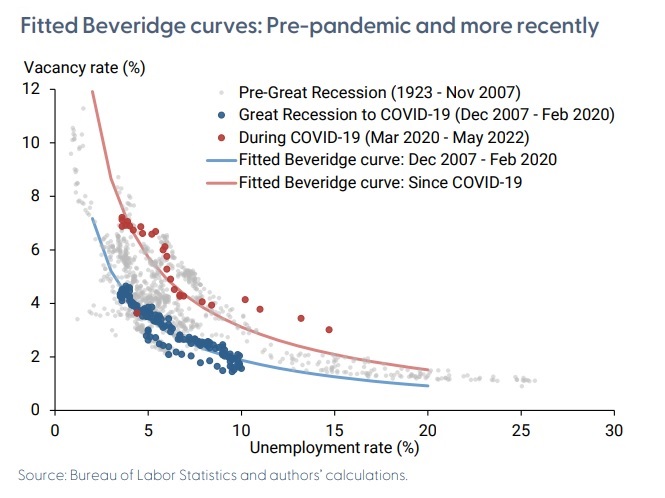
Bok and co-authors note that “the shape and position of the curve reflects the underlying process of matching workers and job openings.” More specifically, “the ease of forming job matches, called ‘matching efficiency,’ is reflected in how close the curve lies to the origin.”
Comparing the red and blue lines, one sees they are similar in shape, but the blue line (most recent data) lies closer to the origin. The report goes on to examine matching efficiency in greater detail.
The researchers write that “the job-matching process is not substantially distorted relative to its pre-pandemic state, even with continued high levels of industry employment reallocation.”
They conclude that “our findings support the idea that unemployment may not rise substantially as growth slows and job vacancies decline.”
They note, however, that if the recession intensifies and layoffs rise, then “unemployment would rise independently of changes in the vacancy rate.”♠️
Click here to read the Economic Letter this posting is based on.
The U.S. Beveridge Curve is by Bkwillwm – Own work, CC BY-SA 4.0.
The second Beveridge Curve is from the FRBSF report.