

Annual global spending on alternative data, estimated at US$7 billion in 2020, provides insights to all kinds of industry sectors. How can financial analysts participate in this burgeoning field?
On March 3, 2021, the Professional Development Committee at CFA Society Toronto held a second panel discussion on alternative data. Alexandra Zvarich, representing the committee, asked the panellists about the role of alternative data especially in finance, where investors are constantly searching for new sources of alpha.
“Alternative data is not new to finance,” said Abraham Thomas, Chief Data Officer and co-founder of alternative data firm Quandl. The firm provides financial, economic, and alternative datasets for investment professionals and was acquired by NASDAQ in 2018. “Equity analysts have always looked beyond the standard data,” he said, citing as example the tendency of savvy analysts to go out and look at markets in earlier decades. “The data explosion is what makes alternative data so unusual.”
“Every company is a data company.” He said that, in the course of normal business operation, a data trail is left by cellphones and satellites, not to mention browser histories as customers click on company web pages. “The early adopters were quant hedge funds, who would look for unused and obscure datasets. But now, start-ups are making data their core business.” He gave some examples of sub-specialties within the field.
Challenges for a Maturing Industry
The use of alternative data in finance has progressed rapidly so “there is no more low-hanging fruit,” Thomas said. “Now there’s too much data, not enough quality. It’s an inedible feast.” He said that his company Quandl compiled the characteristics of a “perfect” data analyst—domain expertise, quantitative expertise, programming in AWS, skill with data engineering and algorithms, and business perspective—and concluded “such a person does not exist!”
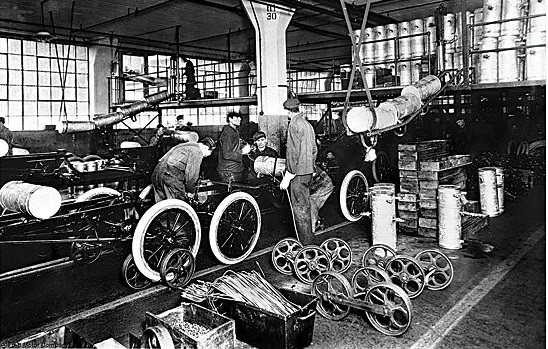
“Good-bye generalists, hello specialists,” he said. “We aim to do for alternative data what Henry Ford did for the car.” The Ford company pioneered the concept of decomposing the workflow and figuring out the specialists for each stage.
Thomas described “the data factory” as consisting of four main stages: Acquire – Transform – Apply – Deploy.

Then he described each of these stages in depth. “In the early days we had a small team doing everything, so it was very hard to find the right person.” Over time, however, “early-stage generalists were augmented or replaced by specialists.”
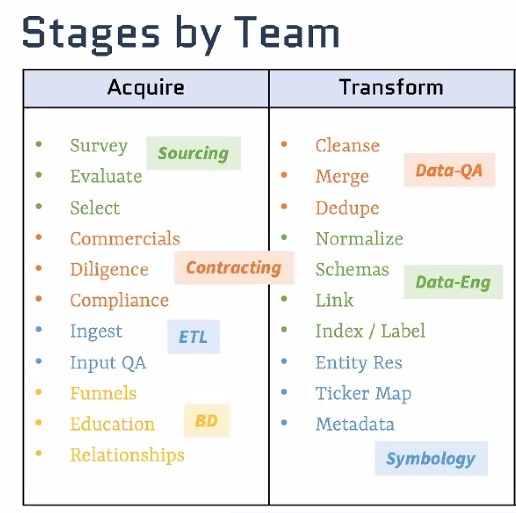
His firm Quandl broke down the operations done in each stage. For example, with sourcing, the analyst must figure out what data to use by creating a thesis and looking for data to disprove the thesis. Contracting is a sub-stage process because the analyst might have to use external data, and the privacy protection regulations “are constantly evolving.”
The ETL (extract-transform-load) that is at the heart of alternative data is only one part of the data factory he described. The accompanying figure shows the specialties for two of the four stages.
Linking geospatial and temporal data
“Data is the new plutonium,” said Jonathan Briggs, the second panellist, “no one wants to share it.” Briggs is Chief Investment Officer at Delphia Technologies, a firm that collects and uses alternative data.
He spoke about the difficulties of integrating ZIP code data with Census Bureau data. “Complications arise when pooling these two datasets.”
He characterized the process as “not ETL but LME—link—map—enhance.” He said about 15 billion data points come in every day and the system at his company could generate about 30,000 predictions a day.
The models begin with a map at a certain point in time. “Entity resolution is a real issue,” he said, because incomplete data can make you think you have more or less of something than what really exists. The third step, aggregation, occurs at different levels of granularity.
“Economic outcomes and price data are tied together in an intricate causal dance,” Briggs noted. Prices are functions of information and expectations. “Prices change when markets are surprised,” with some surprises causing prices to change more dramatically than others.
“Markets are there to allocate capital,” he said, “not to act as casinos.”
Humans exist in a geospatial world. “It matters where you live, work, spend, browse, and socialize.” Plus, there is the temporal dimension. “We think before we act on something.” All of this affects the accuracy of predictions his company can make. “The lower we can link, such as from individual to individual, the better our aggregations.”
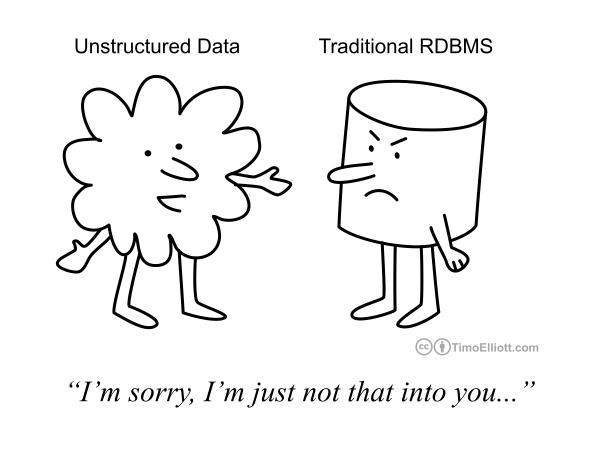
Mapping is important because unstructured data needs an anchor in time, space, entity. “Each dataset type needs specialized algorithms.
Thomas noted companies are increasingly loath to share data. “For example, car sales are no longer published on a monthly basis, only quarterly.”
The search engines act as bellwethers of consumer sentiment. “When it comes to consumer intent, Google search is often the first step.” Some experts predict that the company that gets the most data wins. ♠️