

Every season, but particularly summer, reminds us that global warming is occurring at an alarming rate. The average global temperature will continue to rise over time if people do not take substantial action to reduce greenhouse gases, especially carbon emissions.
What effect will soaring temperatures have on economic productivity? How will warming effects be distributed over the globe? Will these have a long-lasting effect on the GDP?
Recent research by economists at the Federal Reserve Bank of San Francisco (FRBSF) delves into these questions. “Our findings show that total global losses in output per person could be substantial,” say the three authors of a paper released on June 26, 2023. They report the “change in temperature affects GDP growth, but only temporarily.”
The lead author was Gregory Casey, who is assistant professor at Williams College. The other two authors are from the Economic Research Department of the FRBSF: Stephie Fried, who is senior economist, and Ethan Goode, who is research associate.
Ask farmers, roadworkers, construction workers, firefighters—anyone who must spend days outdoors. Temperatures above 68 degrees Fahrenheit or 20 degrees Celsius are less comfortable to work in, and once they they climb above the 30-degree Celsius range, workplaces need to offer workers special protocols.

The trio of economists used a model of economic growth in which productivity partially depends on temperature, in agreement with what is generally observed. “For example, higher temperatures reduce labor productivity in construction and decrease crop yields,” they write. “In our model, the growth rate of output per person depends on the growth rates of productivity and capital.”
Note the modeling considers both the level and the growth rate.
To estimate the effect of changes in temperature on productivity, Casey, Fried and Goode used data covering 155 countries from 1960 to 2010. They used a model in which “the relationship between temperature and productivity is nonlinear: the impact of an increase in temperature will vary based on each country’s annual average temperature.”
They found that “the annual average temperature that maximizes productivity is approximately 13 degrees Celsius, about 55 degrees Fahrenheit.”

The effect of rising temperature depended on where the temperature was rising. For example, a one-degree increase in temperature raises productivity 0.7 percent in Sweden but reduces productivity 1 percent in India. [Side note: such differentials will affect the country risk profile.]
The economists explain this in terms of “optimal” temperature. “In cold countries, defined as those with annual average temperatures below 13 degrees Celsius, higher temperatures raise productivity because they move the countries closer to the optimal temperature. By contrast, in hot countries, higher temperatures reduce productivity.”
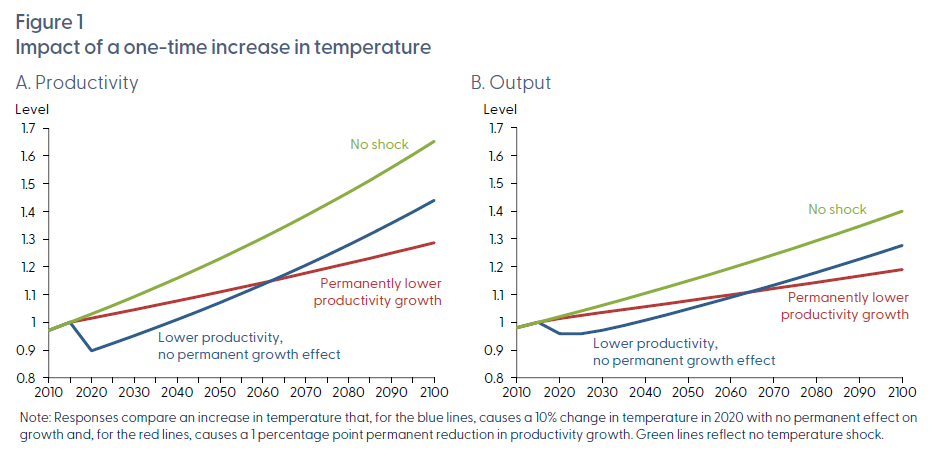
The authors found that “a change in temperature affects the level of productivity but has no impact on its long-run growth rate.” (See blue line in panel A of Figure 1 above.)
They concluded that “a one-time permanent increase in temperature will lead to permanently lower output levels but not permanently lower output growth.” (See blue line in panel B above). [Their emphasis]
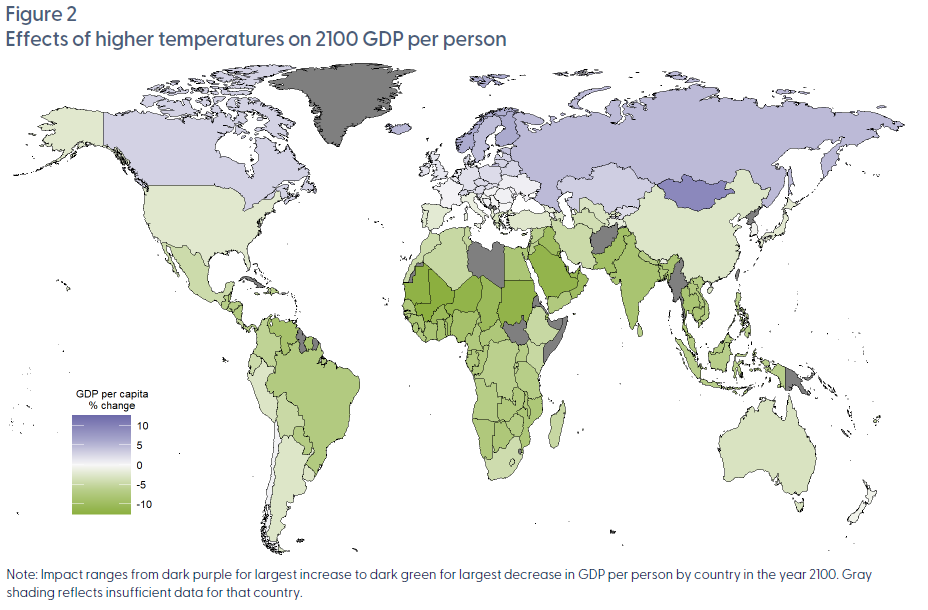
Figure 2 above shows the impact of higher temperatures on GDP per person around the world. The effect on economic growth differs from country to country. Increased growth is shown in purple and reduced growth is shown in green. For example, higher temperatures increase output per person in Sweden by 4.4 percent and decrease output per person in India by 8.5 percent.
In the words of former governor of New York, Eliot Spitzer, “The pace of global warming is accelerating and the scale of the impact is devastating. The time for action is limited—we are approaching a tipping point beyond which the opportunity to reverse the damage of CO2 emissions will disappear.” ♠️
Click here to read the original Economic Letter this posting summarizes.
The two graphs and map are from the Economic Letter; permission is pending.
The other graphics are from the website of the Canadian Union of Public Employees. Permission is pending.