
When looking at stock market time series, one notices immediately a certain “jitter” or “noise” in the daily returns. This is ordinary volatility. Every once in a while, volatility becomes higher and stays that way—for a while.
“Volatility clustering occurs when the volatility of the returns becomes correlated from one day to another,” said Attilio Meucci, CEO and founder of Advanced Risk and Portfolio Management (ARPM). He was the sole presenter at the May 11, 2017, webinar on Modeling and Forecasting Volatility Clustering sponsored by the Global Association of Risk Professionals.
Meucci began by showing an example of volatility clustering in the compounded return of financial markets over the period of years approximately 2008 – 2012 inclusive. “Volatility clustering does not refer to extreme events,” he said, “but rather to the correlation, or predictability, of those extreme events across time.”
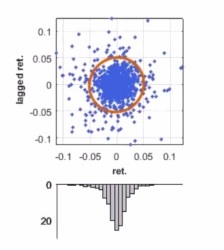
He pointed out that a graph of lagged return versus return had a circular distribution, which indicates no correlation across time.
However, the graph of lagged absolute return versus absolute return had an ellipsoid distribution, which indicates correlation across time.
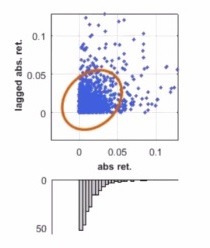
“Volatility is positively correlated through time,” Meucci said. “There is autocorrelation in the absolute returns.”
He described some tools to model volatility clustering, beginning with the simple random walk. “The formula seems so innocent, one wonders how there could be a pitfall,” he said.
He showed a video of Brownian motion, which had a normal distribution of volatility. He went through examples of the Poisson process, which has a discrete distribution.
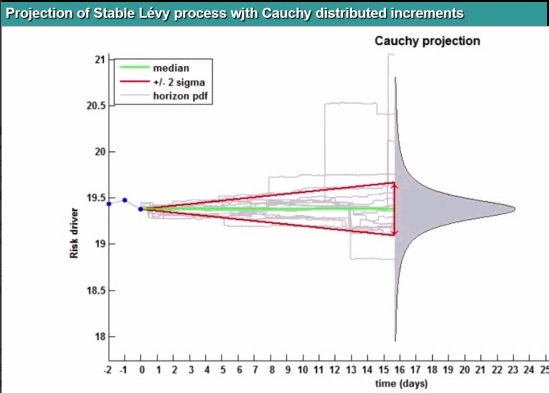
He moved on to fat tails—and showed a Cauchy distribution of a Levy process. In this case, the riskiness propagates much faster than with normal shocks: a 1 percent daily volatility corresponds to a stunning 252 percent yearly volatility.
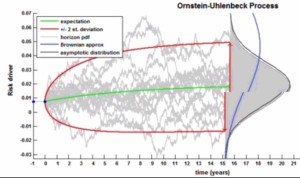
A more sophisticated approach is mean reversion with auto-regression. In the graph of volatility for the Ornstein-Uhlenbeck process, the median rises like a gentle hill.
Meucci presented a stochastic model of volatility. “This is a very common framework to model volatility,” he noted, “but it depends on a variable we cannot observe.”
Then, Meucci commented on “best practices” in econometrics and asset pricing. Such models are then applied to forecast the market volatility over short horizons in the future. ª
Click here to view the GARP Webcast- Modeling and Forecasting Volatility Clustering http://bit.ly/2pa0jxr
The graphics in this posting are screen shots from the ARPM Lab® and are used with permission.