

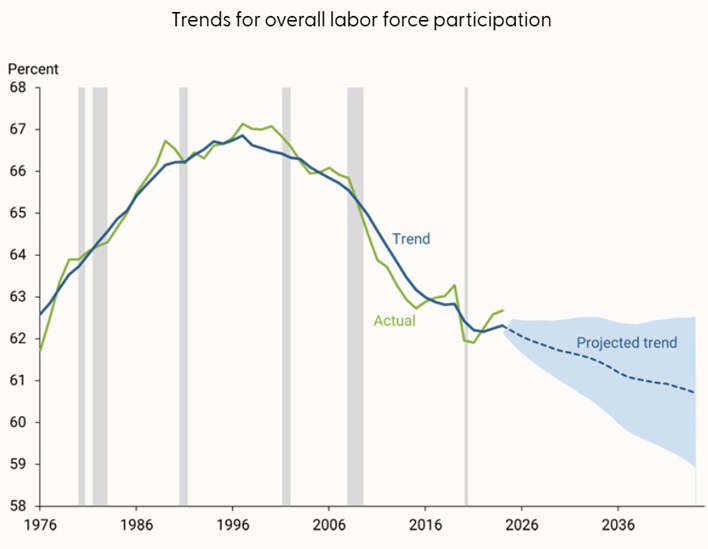
How is the U.S. labor force changing over time? The labor force participation rate has generally been in decline since the late 1990s. Aging explains part of the overall change, since this is when baby boomers began to retire, partially offset by advances in health that have improved the longevity of the workforce. Another reason is the rising educational attainment of the workforce, which means fewer total years spent in the workforce.
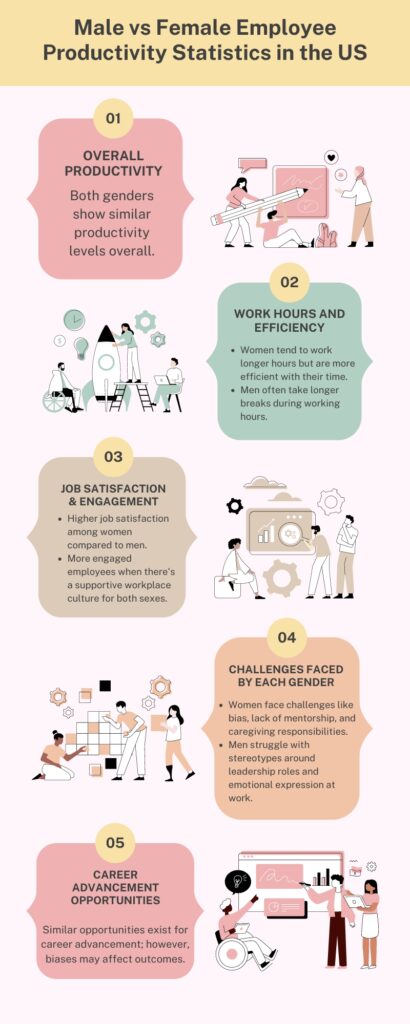
How does the labor force differ by gender? When it comes to things like productivity and choice of occupation, gender differences have been observed.
Could there be differences in the labor force participation rate according to gender? This was the question posed by researchers Andreas Hornstein and Marianna Kudlyak, co-authors of a recent working paper detailing the long-run trends in labor force participation and unemployment. Andreas Hornstein is Economist Emeritus, Economic Research Department, Federal Reserve Bank of Richmond, and Marianna Kudlyak is Research Advisor, Economic Research Department, Federal Reserve Bank of San Francisco (FRBSF).
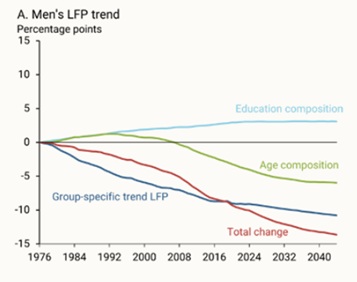
“Men’s trend participation has fallen steadily since the late 1970s, while women’s participation rose through 2000 before flattening,” reports the Economic Letter from the FRBSF released on June 1, 2026. It was co-authored by Andreas Hornstein, Marianna Kudlyak, Greeshma Avaradi, and Taerin Kim.
Method
“Trend” labor force participation is not the observed participation rate. Rather, it is the result after the ups and downs due to fluctuations of the business cycle have been removed.
Using Current Population Survey microdata from 1976 to 2024, the researchers built the overall trend from the bottom up. First, they divided the population by age, gender, and education into 44 groups. Then they estimated the overall trend using weights according to each group’s share of the total population.
Findings
In the two following charts, the red line shows the overall labor force participation (LFP), relative to the level in 1976. In the first chart, for men, the overall LFP rate is on a downward trend, 10 percentage points below 1976 levels as of 2024. (Note the LFP is projected from 2024 onward.)
In the second chart, for women, the overall LFP rate is on an upward trend, more than 5 percentage points above 1976 levels as of 2024.
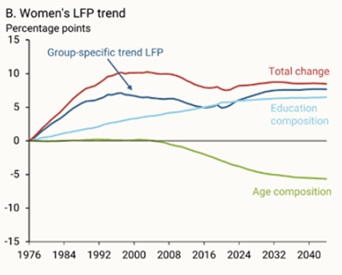
“The difference mainly reflects younger male cohorts participating less than earlier ones, whereas younger female cohorts —especially those with more education —have higher participation,” the study noted.
Future considerations
The Hornstein-Kudlyak model estimates a decline in trend labor force participation of about 1.6 percentage points over the next 20 years. “Aging remains the dominant source of downward pressure, as the population shifts toward lower-participation ages. Rising education is expected to continue to offset part … of that loss,” they wrote.
Women’s trend participation is projected to be comparatively stable over the forecast horizon. More information can be found in the working paper; the link is given below. ♠️
FRBSF Economic Letter: Andreas Hornstein, Marianna Kudlyak, Greeshma Avaradi, and Taerin Kim. 2026. “How Labor Force Participation Has Diverged Across Genders”
FRBSF Working Paper 2026-11: Hornstein, Andreas, and Marianna Kudlyak. 2026. “Trends in Labor Force Participation and Unemployment, 1976– 2024”
The graphs are derived from the Economic Letter. Permission pending.
The graphic “Male vs Female Employee Productivity Statistics in the US” was not part of the study and is only included for interest. It is from Zoe Talent Solutions. Permission pending.