“The Fed is trying to achieve price stability and maximum employment,” said Sylvain Leduc, Executive Vice President and Director of Research of the U.S. Federal Reserve Bank of San Francisco (FRBSF), known informally as “the Fed.”
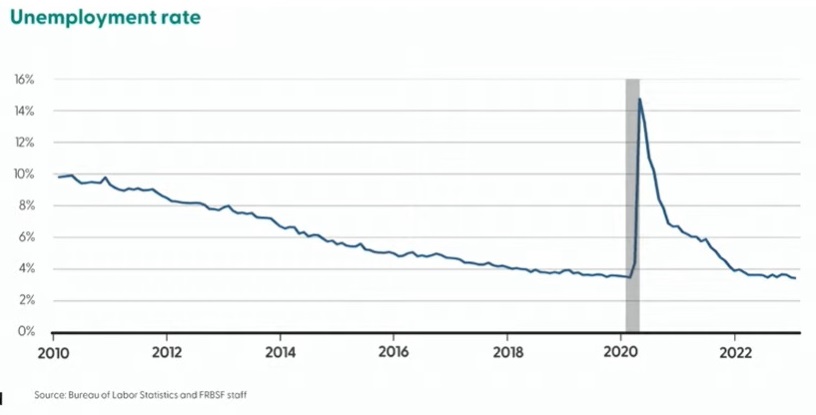
In terms of employment levels, he said, “We are back to where we were pre-pandemic.” He was speaking on February 7, 2023, at a public briefing in which he outlined the FRBSF’s thinking on economic matters. He showed a graph of unemployment, which reached a peak at the start of the pandemic in early 2020.
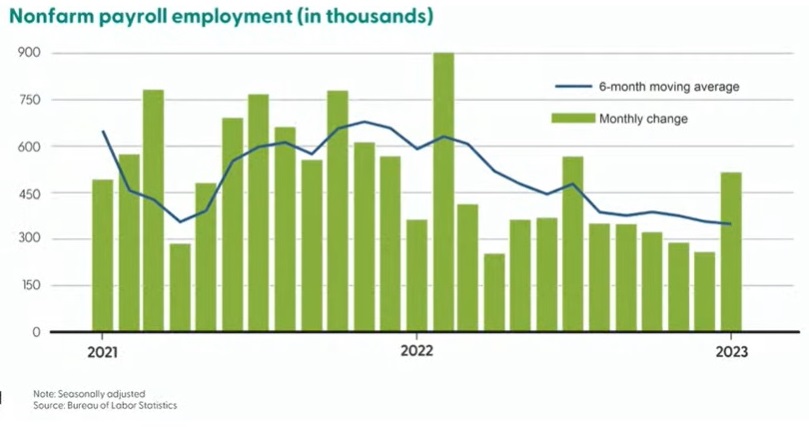
The monthly change in nonfarm payroll employment had a downward arc. “Job gains remain strong,” he said, although since 2022, “we see the job gains are moderating.” He pointed to an outlier for January 2023 and said it could be a one-month “blip.”
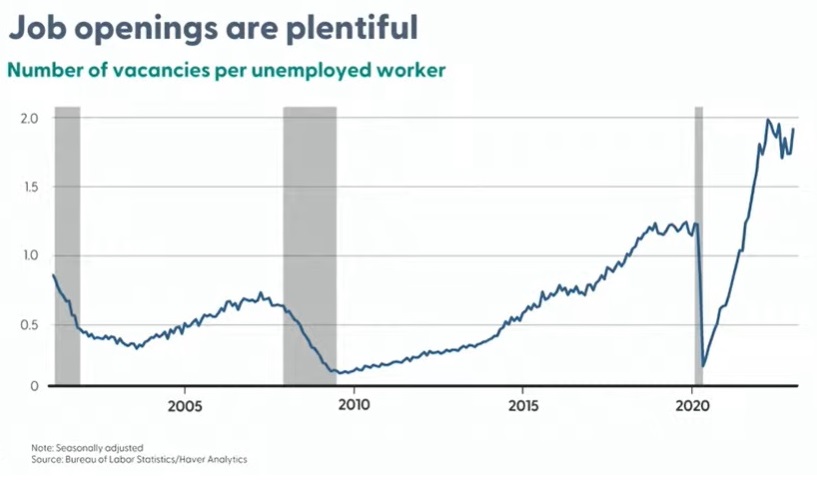
A chart of the number of vacancies per unemployed worker showed an upward trend—except for the start of the pandemic. “Job openings are plentiful,” Leduc said. “It looks like the labor market is doing really well.”
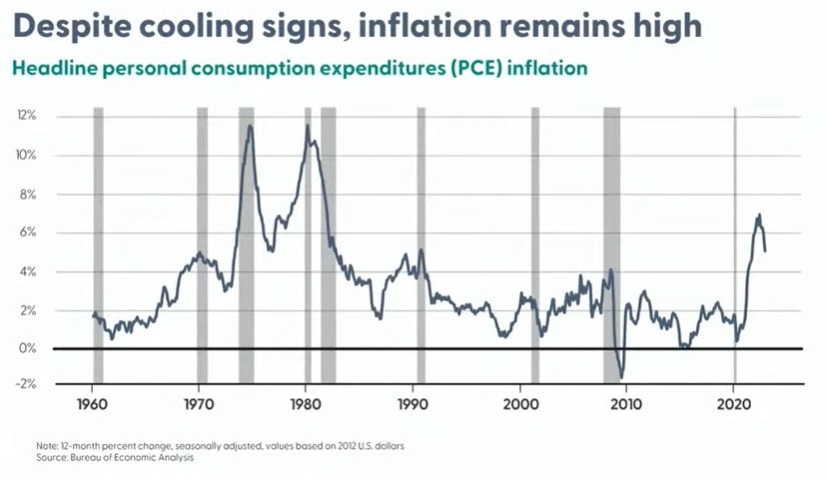
Inflation is a different story. “Inflation jumped after the pandemic,” he said. “Since June, we see it is moderating.”
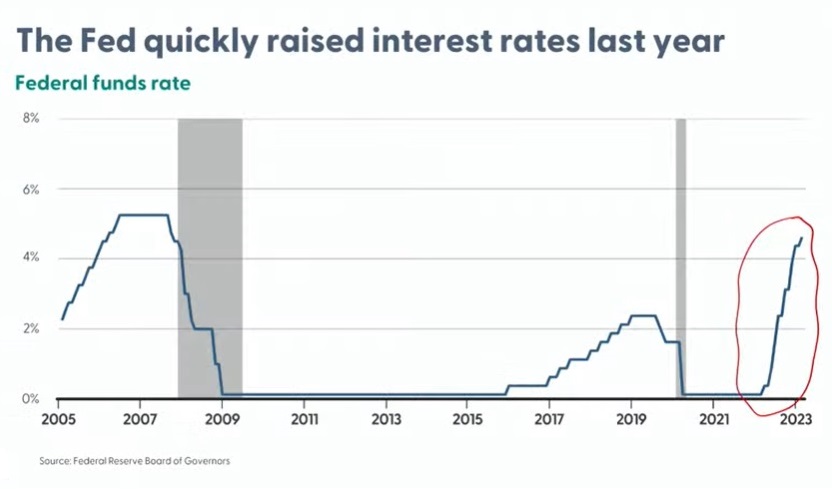
“The Fed is now trying to moderate inflation by controlling interest rates.” The graph showed the steep pattern of rises every quarter, now to almost 5 percent.
To do this, the FRBSF carefully studies a measure knows as the personal consumption expenditures (PCE), also known as consumer spending. It measures the spending on goods and services by people of the United States. According to the Bureau of Economic Analysis (BEA), PCE accounts for about two-thirds of domestic spending and is a significant driver of gross domestic product (GDP).
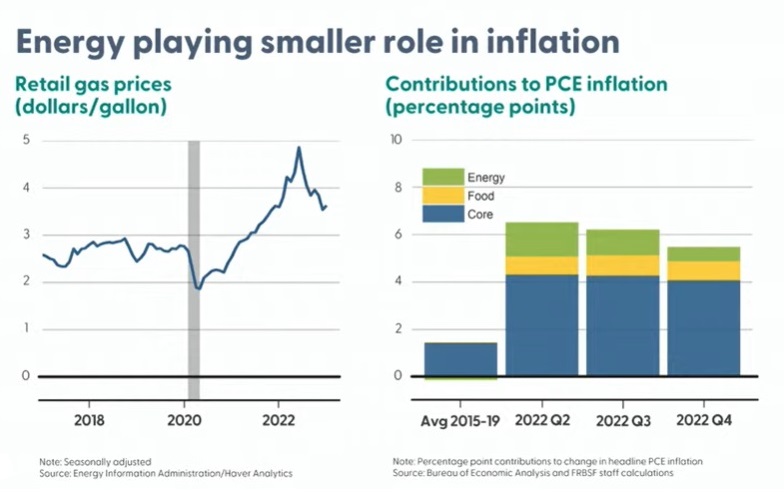
The war in Ukraine, which began nearly a year ago, caused oil prices to increase. This contributed to the increases in the inflation of energy, food, and especially core prices. “Over time,” he said, “energy prices have been decreasing and are now lower than they were a year ago.”
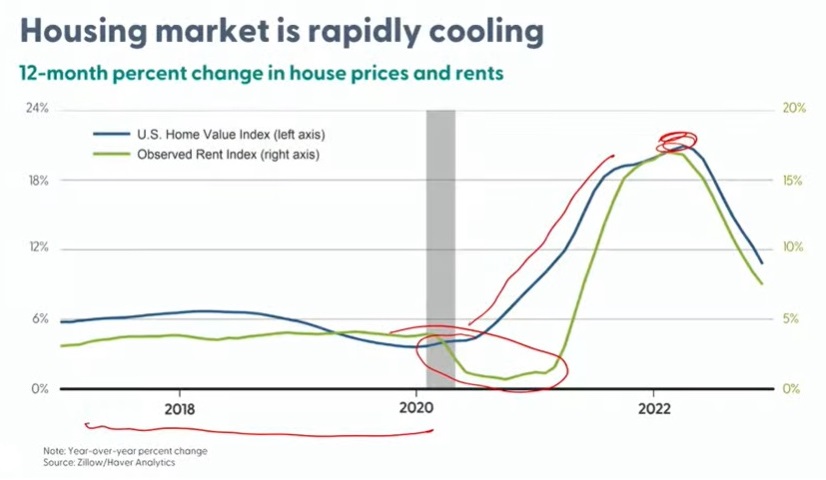
“The demand for housing is cooling,” Leduc said, showing a combined rental and owned chart. [Red marks were added as he spoke during the presentation to emphasize a point; they are not data.] “The demand for rental places dropped significantly during the pandemic, but now it’s picking up.”
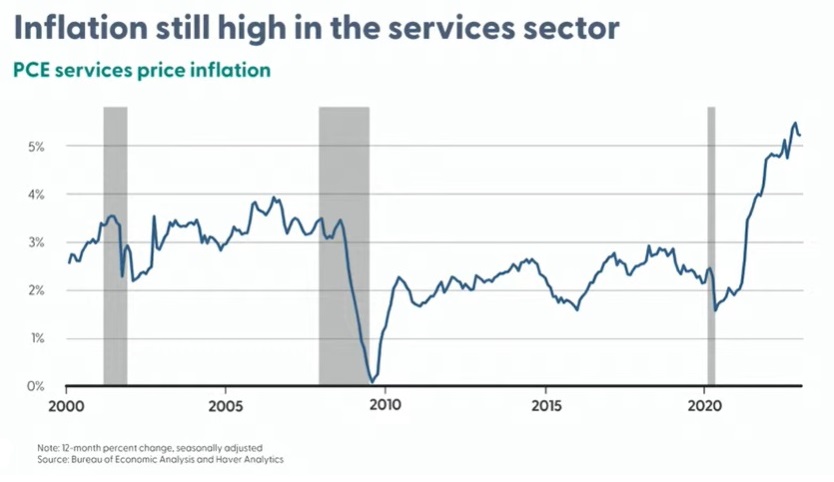
Looking at services in industries such as airlines and healthcare, the Fed found that inflation has increased for both services (about two-thirds of the total increase) and goods (one-third). “Services inflation tends to be more persistent,” Leduc said, showing recent rates hovering around 5 percent.
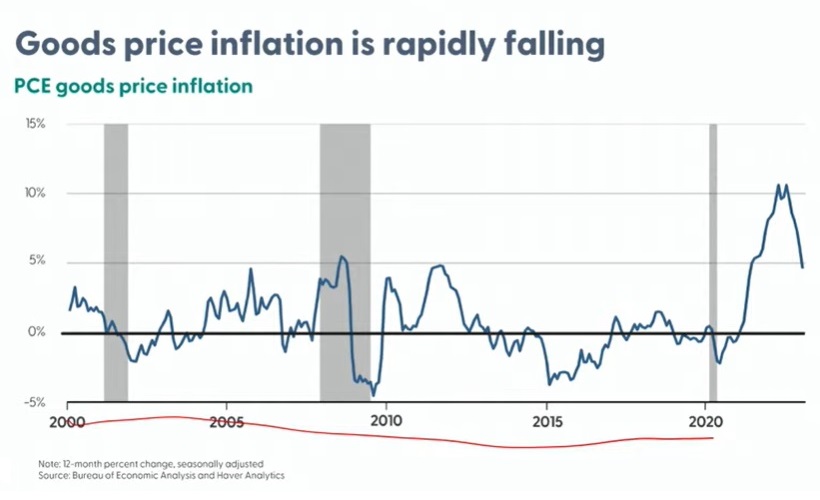
“Goods used to be fairly stable due to competition from off-shoring, then there was a big increase due to the pandemic.” Now, however, the supply chain issues are being addressed. “Goods price inflation is rapidly falling,” he noted. The chart shows a pandemic high of over 10 percent is now half that.
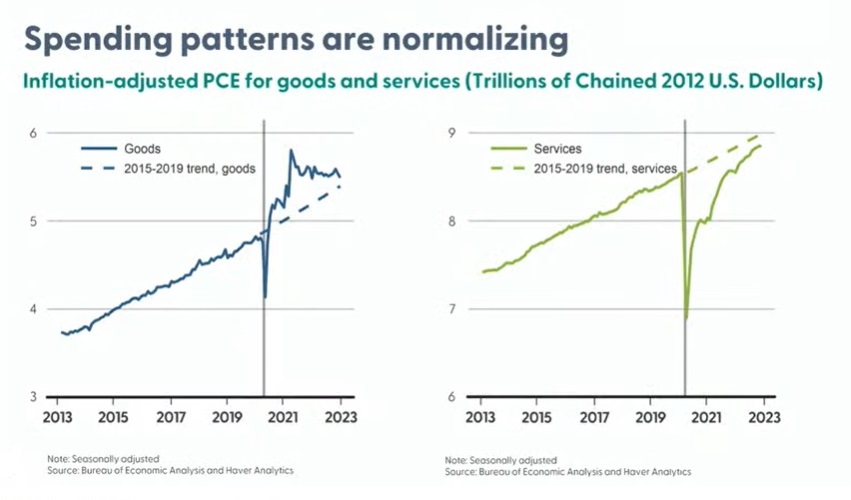
Consumer spending, adjusted for inflation, experienced a sharp decline (as shown) at the outset of the pandemic, but since then, spending has been coming back to normal. On average, consumers were overpaying for goods (some hoarding behavior, mainly supply chain issues), and they were underpaying for services. For both types of PCE, the curves are going back to the trend line.
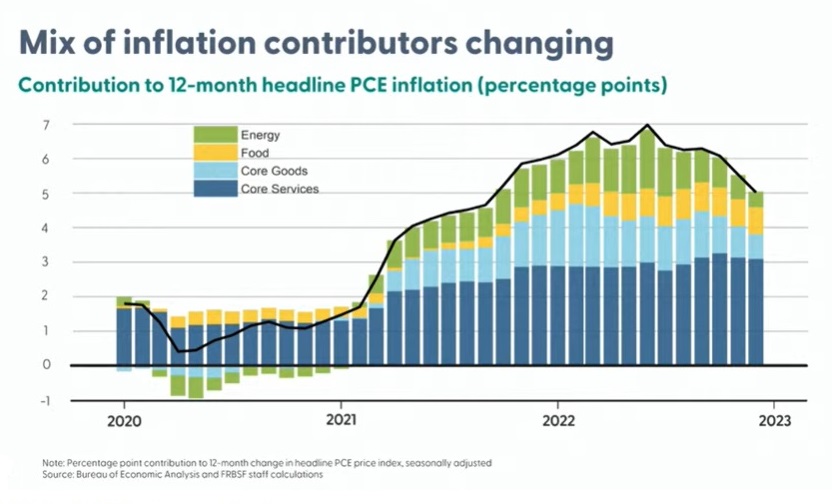
“The mix of inflation contributors is changing,” he said, moving to a colorful chart (below). The green bars show that inflation due to rising energy prices contributed no more than 1 percent during the pandemic (and was, briefly, in negative territory), and has now tapered off to less than 0.5 percent to the current 5 percent total. Food inflation contributes about 1 percent to the increase. Core goods contribute a little less than 1 percent. Core services contribute about 3 percent to the increase—the largest by far.
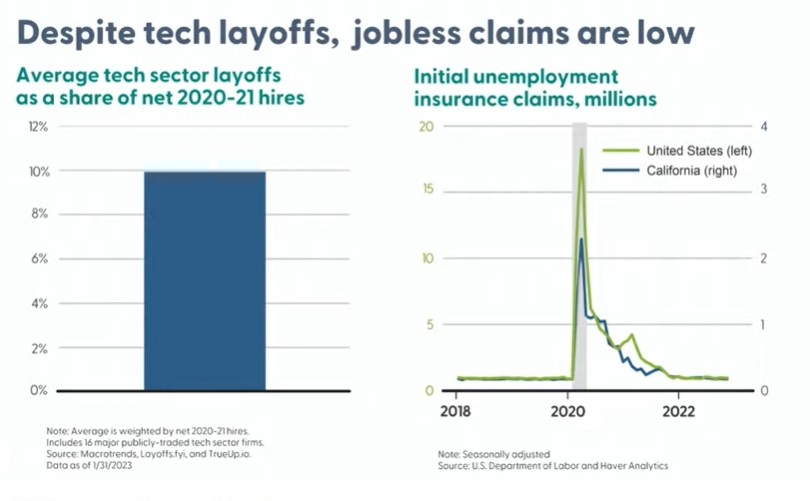
The Fed, located in San Francisco, is noticing the big layoffs in the tech sector, estimated at about 10 percent of the number of 2020-21 hires. This is occurring in other parts of California, and also Portland, Oregon. “Despite tech sector layoffs, jobless claims are low. This may just be the initial phase we’re seeing,” he cautioned. “Demand is still strong in the tech sector.”
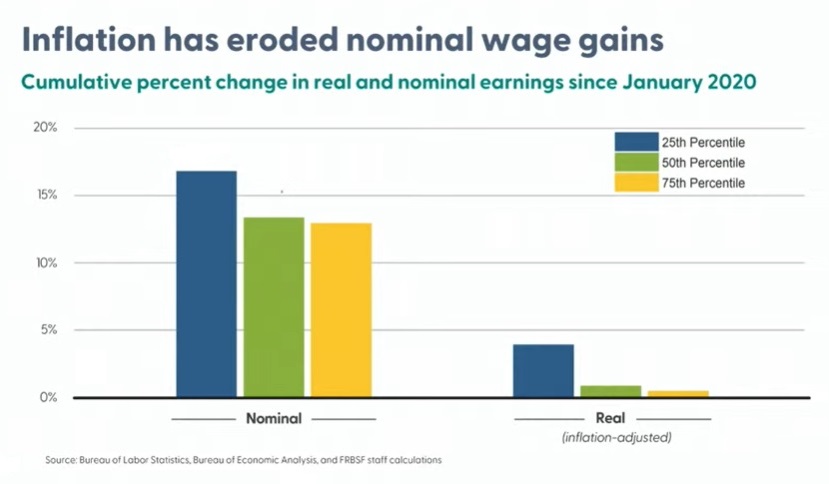
“How does inflation affect people across the economic spectrum?” he asked. Data analysts at the Fed compared upper class (25th percentile wage earners) with lower class (75th percentile wage earners). The high-wage earners had a cumulative change of about 17 percent since 2020. The low-wage earners, about 13 percent. Inflation has eroded the nominal wage gain of all earners. Adjusting for inflation (the RHS of the chart below) shows the high-wage earners come out 4 percent ahead. The low and medium wage earners stay close to zero.
“The Fed continues with its efforts to achieve price stability and maximum employment.” ♠️
Click here to view the YouTube of Sylvain Leduc’s full presentation.
All graphs are from the FRBSF presentation; permission is pending.
The editorial cartoon is from the website of Mr. Sandersen.
The thumbnail image is from the website Liquidity Provider.