
“It gets downright annoying when I’m just trying to check my e-mail but I get prompted to answer three security questions,” said Alexis Johnson, voicing a concern shared by many in the audience when fraud detection is so overblown it obstructs ordinary use of software. Johnson, Director of Technical Sales at the big data analytics firm Ayasdi, was the second of two presenters at a webinar on the topic “The Fraud Arms Race” sponsored by the Global Association of Risk Professionals on April 21, 2015.
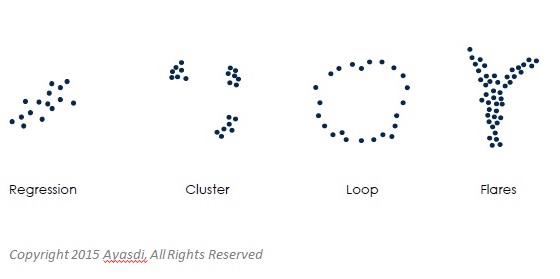
When it comes to detecting fraud in big data, “data complexity, not volume, is the biggest problem,” said Johnson. “There is a shape underlying the data,” such as loops and clusters (see Figure 1) but traditional analytics has trouble discerning the patterns. She said topological data analysis is the best tool for handling the complexity.
The Ayasdi approach combines algorithms from statistics, geometry, and machine intelligence. The method “creates topological summaries (nodes, edges, colour, and position) that reveal insights and patterns.” Johnson described a recent case study, in which the approach was applied to help a corporation efficiently detect fraud—and eliminate numerous pesky false positives.
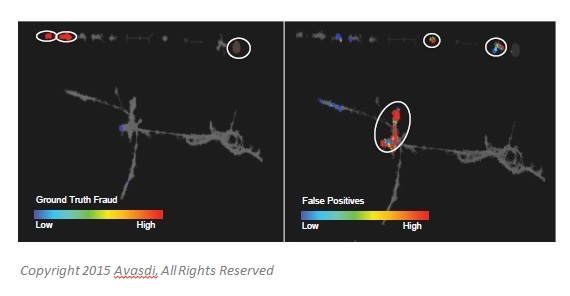
Using a topological approach, the Ayasdi team uncovers regions of fraud in a topological network, systematically explores differences in regions of fraud, and identifies regions of false positives—such as those annoying constant security prompts that can occur when a bona fide user tries to use the system. (See Figure 2.)
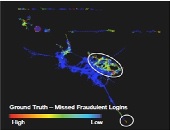
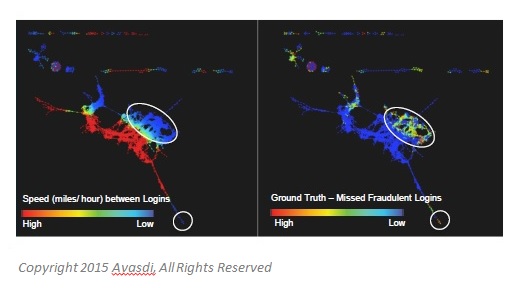
Johnson cited other case studies, such as fraudulent logins that had gone undetected (right panel) where the speed between logins was low (left panel). (See Figure 3.)
Topological analysis can do more than assist in fraud detection. Johnson gave an example of work with a large bank to improve Comprehensive Capital Analysis and Review (CCAR) performance. “What are the critical features and variables within the model that affect performance?” she asked. The customer had thousands of variables, but wanted to eliminate redundancies.
The presentation was followed by a Q & A period, with questions mainly directed to Johnson, whose graduate work included data analysis used in signal processing.ª
Click here to view the webinar presentation. Johnson’s portion is from slides 11 to 29.
Click here to read about the first presentation.
All figures are used with permission from Johnson’s webinar.
Click here to view a ten-minute video of the analysis applied to detect fraud in a big data set.