

“Before we argue about correlation, we must first agree on which interpretation we are talking about,” said Gunter Meissner, President of Derivatives Software, Founder and CEO of Cassandra Capital Management, and Adjunct Professor of Mathematical Finance at NYU-Courant. He was sole presenter at a webinar on October 21, 2014, sponsored by GARP.
Meissner cited three different interpretations commonly used for correlation risk. “In trading practice, it can mean similar movement in time. Or it can be narrowly defined,” he said, “to only refer to the linear Pearson definition.” Third, it can be used in the broader sense of any type of dependency, whether for credit correlation, default correlation, or copula correlation.
He is the author of five books on financial engineering, most recently Correlation Risk Modeling and Management: An Applied Guide including the Basel III Correlation Framework which comes with interactive models in MS Excel/VBA and access to a dedicated website.
Correlation risk has been gaining prominence, especially in light of the recent financial crisis, and it’s been the subject of intense quantitative research lately. Meissner quoted Vladimir Piterbarg, Managing Director of Barclays Capital: “Modelling correlation risk is at the same stage as volatility modelling was fifteen years ago.”
Meissner said the Pearson correlation model has been heavily criticized because it cannot evaluate non-linear relationships. An exact dependence, such as y=x^2, results in zero correlation. It is not a robust model, since it is sensitive to the selected time frame.

“Only if we have a large dataset which is outlier free, approximately linear, and causally related, can the Pearson model serve as an approximation for the association between financial variables,” Meissner noted.
Meissner gave a link to a spreadsheet that shows the impact of correlation on the return/risk ratio of a portfolio. For example, a chart constructed using this spreadsheet shows that the return/risk ratio μP/σP can be enhanced with an increase in assets or a decrease in correlation.
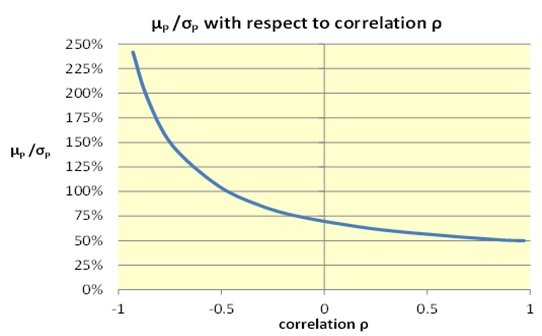
“Every fund manager should try to put negatively correlated assets in the portfolio,” he urged. “It’s like a free lunch.”
Correlation-dependent products and strategies are available at major investment firms. “Dispersion trading is a play on the correlation,” said Meissner. There are correlation swaps, and, since the mid 1990s, correlation-dependent options are available as exchange options.
The price of multi-asset options (also called rainbow options, or mountain range options) “depends critically” on correlation between the assets, Meissner emphasized.
In dispersion trading, “we are deriving the correlation between the assets from volatilities,” said Meissner, “not from the data points themselves.”
If a trader expects an increase in correlations—typically in a recession—then he or she should buy options (straddles) on the overall portfolio and sell options (straddles) on individual stocks (short dispersion). And vice versa, if the trader expects correlations to decrease, such as during an economic expansion.
Meissner spoke about risk management vis-à-vis correlation. He summarized a variety of ways to quantify risk: through the volatility equation, Sharpe ratio, value at risk (VaR), expected shortfall, and extreme value theory. “All risk measures have a critical input: the correlation between assets,” he said.
To demonstrate the impact of correlation could have on, say, a VaR model, Meissner showed a worked correlation example that is also available through the DerSoft website.
The second half of Meissner’s presentation began with a slide on the correlation and the recent financial crisis: “Can we blame the Copula Correlation Model for the Global Financial Crisis?” Due to technical difficulties, he was not able to discuss this aspect of correlation risk. Once the difficulties have been solved, we hope that GARP will re-schedule his concluding talk on this important topic. ª
Figures used from Dr. Meissner’s talk by permission. The curve was generated by DerSoft software.