“The core concept for data science is hypothesis testing,” said Nima Safaian, team lead for Trading Analytics at Cenovus Energy. The data scientist must identify trends, generate hypotheses, and test, test test. The scientist’s bent toward hypothesis testing should be even stronger than their math skills. Safaian was speaking at the Data Science webinar on August 2, 2016, sponsored by the Global Association of Risk Professionals (GARP).
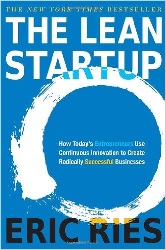
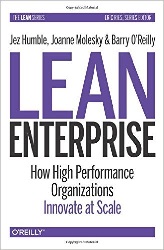
“Attitude is everything,” Safaian said. “Think like a startup. Have an agile mindset,” he urged, referring to the books The Lean Startup by Eric Ries and The Lean Enterprise by Humble, Molesky, and O’Reilly. Solve the problem that matters, and use a small-batch approach to see if the solution actually solves the problem.
“Communicate to influence,” he said, emphasizing that reports should be timely and flexible. “Two years ago I gave up on static reports,” he said. “Now you can understand how users are interacting with your analytics.”
Besides having an entrepreneurial bent, the ideal data scientist has sound business knowledge, including a deep understanding of the sources of risk and reward. They know the importance of storytelling (and/or infographics). They have “hacking skills,” which he defined as “using all means at their disposal to get the answer.” Safaian confessed that although he tended to hire people with quant backgrounds similar to his own, he had observed that “some of the best data scientists come from a humanities background—they have a hacking mentality.”
As far as platforms, Safaian recommended going with open source such as R language. “It’s about the community behind these products,” he said. Because R is one of the most popular tools in the data science toolbox, there is a large community, which has contributed over 7000 applications in statistics and graphics libraries.
However, regulated financial institutions (FIs) tended to have “hesitations about open source.” He explained the FIs “wanted a company behind analytics software, their reason being that ‘if there is any issue we can sue the company.’ My response to them was: ‘when was the last time you could sue Microsoft for a bug in their Windows software?’ The expectation always is, most vendor analytics software come with limited liability, and it is up to the user to ensure the analytics generated using the software is sound. This is no different in the case of either open source or paid tools.”
Safaian cautioned that Excel spreadsheets “lead to a silo mentality both in terms of data and analytics. This is more the result of how people use the tool than the tool itself.” There are three criteria to select a data tool: it must scale up; library import must be easy; and it should “relate well to others’ work.”
At the end of his presentation, Safaian encouraged the audience to join the Data Science group at GARP. He provided links [given below] to five on-line videos about data science for risk professionals, showing cases worked in RStudio using MongoDB and NoSQL databases. ª
Click here to read about Part 1 of Nima Safaian’s presentation.
The visual for data scientist in this post is from KD Nuggets.
The links to the Data Science videos are as follows:
Session 1-Ingesting Data and use of APIs
Session 2-Cleaning and Wrangling with Data
Session 3-Exploratory Visualization
Session 4-Descriptive Statistics and Building Models
Session 5-Deploy the tools as an online app (contains example of bitcoin pricing)


