

In the world of finance, investors are constantly searching for new sources of information that could help them generate alpha. Many of them have recently turned to alternative data. But what, exactly, is alternative data? And why should investors (and those seeking a career in finance) care about it?
On February 17, 2021, the Professional Development Committee at CFA Society Toronto convened a panel discussion to demystify the alternative data industry. Alexandra Zvarich, representing the committee, questioned the panellists about insights they could share, and how to prepare for a career in this area.
“We worked with alternative data before it was cool,” said Adam J. Baron, Director, Big Data Quantitative Research at Refinitiv, a provider of financial software and risk solutions. The company delivers news, information, and analytics; enables transactions; and connects the global community. It was recently bought by the London Stock Exchange. He spoke from San Francisco.
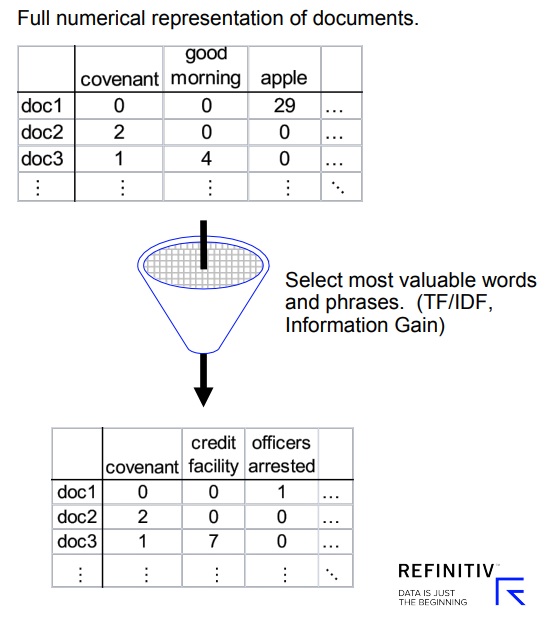
“There is no precise consensus on what alternative data is,” Baron said, but as a working definition, he thinks of alternative data was “anything that is not traditional financial data such as stock prices and fundamentals.” Some alternative data is structured, such as credit card data, but often it is not. Some alternative data occurs as text, and that can contain either formal language (e.g. in annual reports) or informal (e.g. the verbal discussion during analysts’ quarterly meetings with a company).
“Many sources of alternative data start from the data exhaust of a primary business,” Baron said. Data exhaust refers to the trail of data left by the activities of users during their online activity and can includes geospatial, network, and time-series data.
There are now some “vendors that originate alternative data as a primary business. They do this through web scraping and polling.” Web scraping involves extracting data from websites.
Some alternative data occurs in the form of images such as satellite images of parking lots of shopping centres.

When Zvarich asked, “why should people in finance care about alternative data?” Baron replied, “Why not? Eventually someone important is going to ask why you’re not using alternative data.” Having a different source of data can give the analyst a competitive advantage, knowing things ahead of time, and discovering uncorrelated factors. “Everyone is motivated by alpha and risk,” Baron said. “There are schools and boot camps teaching skills for alternative data … and vendors of alternative data eager to sell.”
Baron gave a timeline of numerous projects he had been involved with over the years, including text mining credit risk, scoring sentiment in media reports, text mining job postings, satellite images of parking lots and grain barges, GPS data, and online catalog purchases, to name a few.
Furthermore, he noted, projects could be restarted. “Sometimes it’s worth revisiting with a deeper history and/or a new alternative data vendor.”
Nowadays there is a cornucopia of choice for datasets and data providers. Ubiquitous cellphones and the desire for free apps mean wide coverage.
Baron had some advice for those who are trying to set up an alternative data project. When trying to find insights from raw datasets, Baron said, “getting to ‘no’ is fast, getting to ‘yes’ takes time.”
He suggested looking for big gaps, spikes, and extreme values in the data. Something to consider before plunging into a full-fledged quant study is “What kind of time-lag is there?” He noted it was crucial to “know the difference between when the captured activity happened versus when it was published to consumers of the alternative data.”
An alternative data analyst must also consider “how hard is it to pull out the information?” He noted, “You’ll likely have to manually intervene for unmapped high-coverage entities.”
Also, analysts should “slice and dice the universe to see if phenomenon is robust across all slices or only certain segments.” They should pay attention to the sector/industry and ask, “Does coverage bias make sense?”
“You should hypothesize instead of data mining,” he urged. Academic research often contains an example to begin with. Don’t be afraid to cherry-pick examples at the beginning. “Set it as a goal post, and then set up the study around it.”
“Extract, transform, load,” he summarized were the top technical quant skills to hone.

Beware the rose-tinted lenses
“How we interpret the data is more important than how we get the data,” said Neil Seeman, Chief Executive Officer at RIWI Corporation, a global trend-tracking and prediction technology firm.
He pointed to the growing optimism bias in the news of late, where good news stories are seized on and magnified despite the fact we are in the middle of a global pandemic.
Seeman defined the acronym “WEIRD”: Western, educated, industrialized, rich and democratic.
“WEIRD media tend to amplify loud and angry voices,” he said, which is why “WEIRD traditional survey data exhibit growing sampling biases.” He pointed to recent polling errors in Brexit and U.S. presidential elections. “We’re getting increasingly narrower slivers of data from people who respond to surveys.”
We live in an age with “a surfeit of data but major interpretation challenges.” Seeman said that decision-makers need to hear from diverse voices to assess and predict economic realities. “RIWI showed that U.S. workers were experiencing a second round of layoffs that had not yet been publicly reported,” he noted. “The policy impact of RIWI’s work changed the narrative in Washington, D.C.”
The more data that goes beyond the rich urban areas, the more accurate a prediction will be. As an example, Seeman pointed to recent tracking done by RIWI that correctly predicted a “U-shaped recovery” post-pandemic instead of the “V-shaped recovery” that pundits first anticipated.
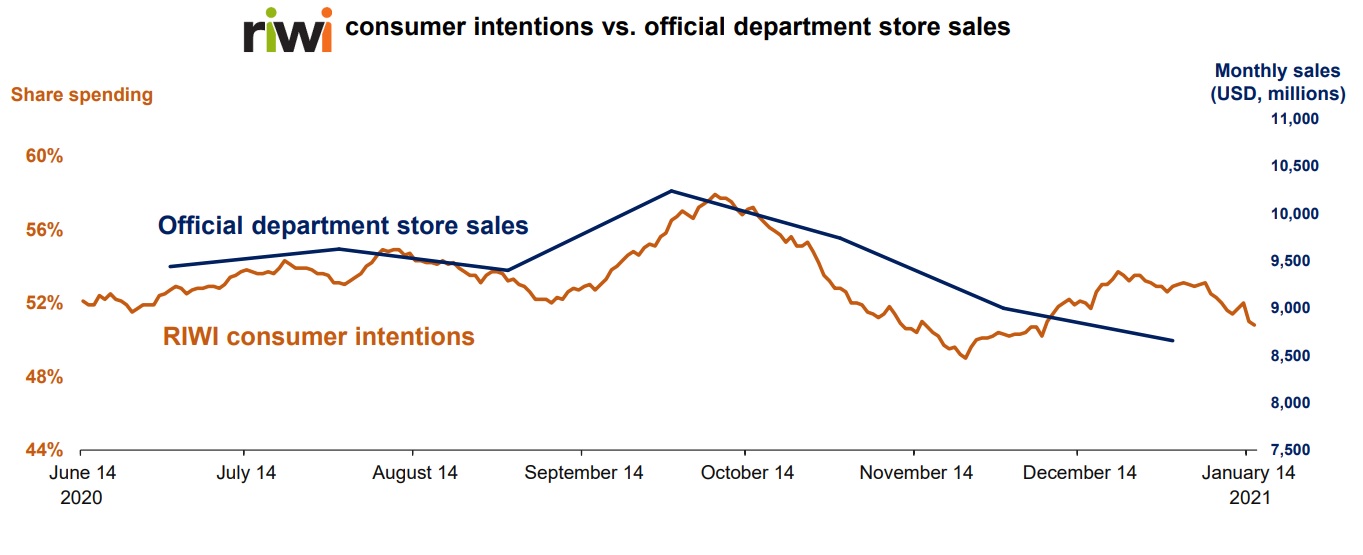
RIWI has recently been looking at consumer intention data and predicted the retail sales slump in November 2020.
A highly revealing slide contrasted data from RIWI about economic sentiment. The firm asked a diverse range of voices about expectations on three levels:
- Belief that the overall economy would worsen;
- Belief that their personal financial situation would worsen; and
- Whether the respondent had been unable to pay bills in the past month.
This chart shows how the responses varied month over month.
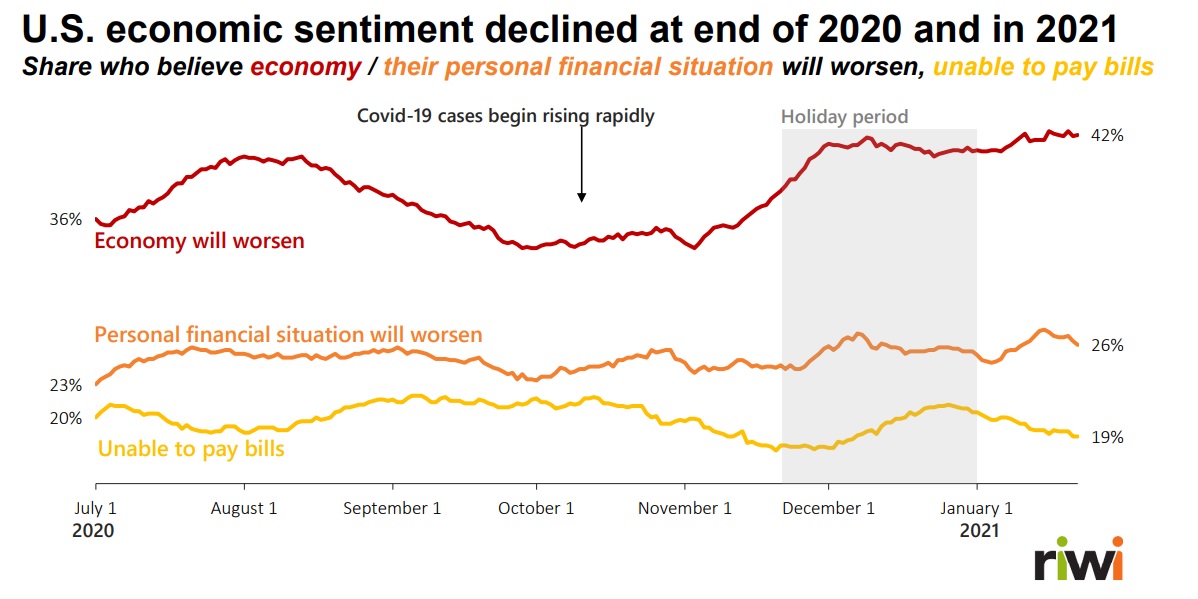
“It’s tough to assess the changes over time,” Seeman said. “We’re finding that people are tired of bad news and ordinary survey data is prone to systemic bias. We must listen to the quiet voices.” ♠️
The text mining image was used in slides from Refinitiv.
The charts of consumer intentions and sentiments appeared in slides from RIWI Corporation.
No endorsement of Slice ‘n’ Dice Pizzeria is intended.