
When looking for good data analysis tools, many financial professionals turn first to MS Excel which displays numeric data, contains advanced functions, and can be programmed with Visual Basic. A growing number of professionals are turning to MATLAB which has strengths complementary to ordinary spreadsheets. At a webinar on January 15, 2013, Adam Filion, application engineer at MathWorks, showed approximately three hundred audience members how easily features of MATLAB software adapt themselves to rapid analysis of large datasets.
In Excel functions, the input is specified as a cell location and the math is hidden. In MATLAB, the interface has a different emphasis. The numeric data are tucked away in a named matrix. The primary space is the command window. Filion showed some simple commands, such as the sine of a 2 by 2 matrix, being evaluated directly in this window. (See accompanying figure.)
 Opening the newest MATLAB program will show a graphical user interface (GUI) with a command window and workspace, just like the old versions of MATLAB, but the toolbar along the top is a big change in this release (R 2012 b), Filion pointed out. The toolbar has tabs (shown here: Home, Plots, Apps, Shortcuts) in a “discoverability” design, he said. [Ed. Note: The change is reminiscent of the difference between MS Word 6 and MS Word 2007.]
The example Filion went through was a solar radiation model that depends on humidity and temperature. He had several datasets with historical measurements. He wanted to develop and test a predictive model by fitting an analytical function to determine the best fit of coefficients. He wanted to document the analysis, and extend the analysis to all datasets so that ultimately he would have an automated means of determining the coefficients.
“MATLAB inherently understands the data as matrices,” said Filion. He showed how the Import Data function could customize how and which data columns were imported from a spreadsheet, including specification of rules for how to handle missing data or negative values. Once the customization was done through point-and-click in the GUI, he selected Generate Function to create MATLAB code so that he would not have to constantly re-set the GUI. [Ed. Note: Generate Function in MATLAB is comparable to Record Macro in MS Excel.]
To visualize the data, Filion clicked on the Plots tab and selected a 3D display. In the command window, he demonstrated the difference between logical indexing and subscripted indexing. Logical indexing is a way to tell MATLAB “give me all elements in the matrix whose value is greater than 5,” for example.
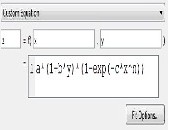
In creating a model, Filion reserved some points for testing the goodness of fit but used most of the points to determine a good fit of the data. From the Apps tab he chose Curve Fitting. By default the method is “linear interpolant” but in this case he had a closed analytical form for solar radiation so he selected “custom equation” and loaded the typed-in formula. (See image.)

The software proceeded to determine the best fit of parameters for the equation and calculate the goodness of that fit. The “predint” function will then give a prediction from the model within, for example, a 90 percent confidence interval. Filion also created a stem plot to show the error between actual and estimated values.
The Command History window is like a continual log of the user’s MATLAB work, and it will save sessions from several months previous. Old commands can be selected and a right-click will allow the user to generate a script based on those commands. Filion selected the Editor tab to paste the code into its own window. Comments were inserted with the % character; entire sections were formatted with the %%-characters. The beauty of sections is that the user can run only one section at a time, and repeat as needed—a helpful debugging feature.
 Clicking on the Publish tab will allow the user to run a script and compile output into a report that includes the sections of script and the output. The report file can be saved in html, pdf, TeX, and other formats to give a detailed, comprehensive, and attractive final document.
This is a welcome step up from other software that creates beautiful documents but does not show the nuts-and-bolts script commands of the data analysis.ª
The webinar presentation slides can be found at: http://www.mathworks.com/company/events/webinars/wbnr37971.html?id=37971&p1=1245719536&p2=1245719527
Disclaimer: The author does not hold shares or receive commissions from any products mentioned in this article.