
The Gumbel copula is the best way to aggregate losses in economic capital, says Yimin Yang, Director of Model Risk and Capital Management Practice at Protiviti, a global consulting firm. “This copula has asymmetrical behaviour and can model fat tails the best” of the numerous copulas he has tried recently. He was speaking at a GARP webinar on August 20, 2013.
Yang began by explaining that a copula was a broad class of mathematical function that could be used to describe the joint distribution function between two or more other functions. Such a joint cumulative distribution function (CDF) must determine a copula function (which is unique when continuous) that takes input values between 0 and 1 from the original two or more variables.
Yang discussed the particular case of aggregating economic capital between two portfolios such as retail and commercial credit. “How do you add two losses?” He said a copula can be thought of as an algorithm for how to rank the combined sets of two numbers.
“Calibrate the copula by determining its parameters,” he advised, using internal or external or hybrid data. Simulation of the copula will give the order of summation. The advantages to simulating a copula are that the individual loss distributions do not need to be known, and that the model can be calibrated using other data, as well as ease of implementation.
There are many copulas available, of two main types: Elliptical and Archimedean. Gaussian copulas were prominent during the financial meltdown, and Yang said they should be avoided because they show unrealistic symmetry, treating losses like profits.
The Archimedean class of copula can be further sub-divided into three families (Clayton, Frank, and Gumbel), depending on the structure of the tail. “You want to choose a function that has non-symmetrical behaviour when it comes to sensitivity to the loss correlation,” said Yang. Due to the character of economic capital, the copula “must have high sensitivity to large loss but low sensitivity to small losses.”
Yang emphasized the Gumbel copula was appropriate for loss distributions but a different type of copula should be used for distributions of returns “because the tail is different.”
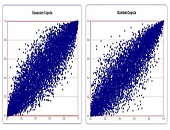
The accompanying figure contrasts the Gaussian and Gumbel copula functions on a grid showing percent losses in one variable (X) versus percent losses in the other (Y). The Gumbel copula is more diffuse in the lower left-hand corner and it grows to a “sharp tip” distribution in the upper right-hand corner. “This is the appropriate shape of asymmetry that we want.”

Yang briefly described the calibration tools for the parameter theta or Kendall’s tau, or the K-function for an Archimedean copula. He showed the function for 2- and 3-dimensional cases. The objective for using the K-function is to “actually derive an explicit calibration formula under some optimization technique you can use.”
How can the copula be calibrated? Yang showed an example where he used Fed data of quarterly charge-offs for the past 25 years, calibrated the K-function, and then simulated the copula. “Now return to your portfolio with loss distributions for different component portfolios,” he said. “You can get the loss distribution and the 99.95 percentile economic capital for the combined portfolios.”
Aggregation of economic capital is a thorny problem, and this presentation was a clear step-by-step use of a special type of copula to address this need. ª
The webinar presentation slides can be found at: http://event.on24.com/r.htm?e=654478&s=1&k=6466C31565DB4274F18CC0C7B16E981D