

War, Kidnapping, Data Theft
War, kidnapping, and data theft: Is it some fiction pot-boiler that’s come over the transom? No, it’s the chapter on how the gross domestic product (GDP) came into being in Germany. Today’s excerpt comes from pages 117-8 of the book The Power of a Single Number: A Political History of GDP by Philipp Lepenies, translated by Jeremy Gaines (Columbia University Press, 2016). “[John Kenneth] Galbraith was surprised by the results of his calculations and surveys because they, for the first time, provided a clear picture of the Nazi economy. Because no set of tools comparable to gross national product calculation existed on […]
Platform of the Future
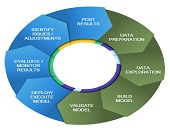
What will be the ideal modelling platform of future bankers? It will need to contain key functionalities in model execution, scenario management, and a “risk engine” that will deliver answers for multiple horizons at the loan level. Furthermore, it should implement the most advanced modelling suites, reduce the quants’ time to develop models, and contain simulation capabilities for stress testing and beyond. This bold vision of the future was presented by Martim Rocha, Advisory Business Solution Manager at SAS. He was the second of two presenters at the February 25, 2016, webinar offered by the Global Association of Risk Professionals […]

Integrated Data and Modelling
How can today’s bankers prepare for tomorrow’s challenges? Consider the financial models built using available data. Data collection and financial modelling used to be conducted in each different silos of the bank, with credit separate from market, which was separate from treasury and other groups). Then data became “managed” and modelling was moved to “platforms” which did not mix well between the various silos. A few brave souls began to integrate the data management for different groups of the bank. Other brave souls tried to integrate the modelling. This was the phase of integration achieved through batch calculations. Now, the […]

Lagging in Technology Solutions
When it comes to new regulatory requirements for advanced models in financial stress testing, are banks meeting expectations? Over the past two years, relatively good progress has been made in financial models and managing data for stress testing, said Tom Kimner, Director of Global Risk Operations at SAS, “but less progress has been made in technology and reporting.” He was the second of two panellists at a webinar on September 22, 2015, sponsored by the Global Association of Risk Professionals (GARP). He was presenting the findings from a survey report, “Stress Testing: A View from the Trenches,” that was jointly […]
Rising to the Challenge
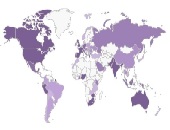
What kinds of financial institutions are scrambling to comply with new regulatory requirements for financial stress testing? In 2015, the Global Association of Risk Professionals (GARP) conducted its first industry survey to see how banking institutions worldwide were coping with more stringent regulations. They produced a report, “Stress Testing: A View from the Trenches,” and on September 22, 2015, two panellists presented their findings during a webinar to members of GARP. “Institutions on the whole are purposefully addressing the challenges,” said Jeff Kutler, Editor-in-Chief of Risk Intelligence at GARP. “There has been significant progress in data, modeling, and scenario management.” […]

Conference Call Tones. Part 2
Click here to visit Part 1. Interview with S. McKay Price, continued. Q: In the introduction to your paper on textual analysis of conference call tones, you describe a 2012 conference call in which David Einhorn grilled the management team of Herbalife, thereby causing the shares to fall 20 percent in price. Did you run the transcript of this conference call through your call tone algorithm, and if so, was it the most negative sample in the set? 2012 was not in our sample period so we did not specifically create tone measures for that Herbalife call. Although I suppose […]

Old Dog, New Tricks. List of Tricks
The following are a dozen helpful things I learned at a day-long seminar “The Power of Excel – Part 2,” held on location at the offices of the CFA Society of Toronto on June 10, 2015. The seminar was conducted by Jon Zelman of The Marquee Group. 1. Resist the Mouse 2. Best shortcut of the day 3. ALT-ernative Existence 4. If you filter, use SUBTOTAL, not SUM 5. To count the number of visible rows 6. Searching with multiple conditions 7. D is for Database function 8. “Exact” string matching versus “includes” 9. Multiple conditions for SUMIF 10. Weed out bad parameters early with Data Validation 11. Match and Index functions complement […]

Old Dog, New Tricks. 11 & 12
11. Match and Index functions complement each other “The INDEX function is one of the most powerful but also one of the most complex functions in Excel,” Zelman said. Both INDEX and MATCH are Lookup functions in Excel, so whatever comfort you have with VLOOKUP or HLOOKUP will be useful here. Big picture: you use MATCH to find the coordinates, and you use INDEX to apply the coordinates to find a value. The Match function returns the relative position of an item within a column of data (or a row of data). The syntax is MATCH(lookup_value, Lookup_vector, Match_type). Note I […]

Old Dog, New Tricks. 9 & 10
9. Multiple conditions for SUMIF Let’s say a table has a dollar column you want to add up, but only for entries that have “Industry” = “Finance” whose “Lead Underwriter” is “Morgan Stanley”. You could set up Filter and then use SUBTOTAL, as described above. Another way to get the answer is using a type of SUMIF … the type with multiple conditions. To give multiple conditions to a function such as SUMIF or COUNTIF, use the functions SUMIFS or COUNTIFS instead. The general syntax is SUMIFS(dollar column to be summed, column of name1s, name1 criterion, column of name2s, name2 […]

Old Dog, New Tricks. 7 & 8
7. D is for Database function “Excel’s Database functions are some of the most powerful and underutilized functions in Excel,” Zelman said. Those formulas starting with “D” such as DAVERAGE, DCOUNTA, DVAR, and so on, are all set up to work on a database, which is typically shown as a flat table of numbers and text (rows and columns). The Database functions all use the same syntax: DCOUNTA(Database, field, criteria). He specified four steps for setting up a Database function. Ensure the raw data has column headings. Add a few blank rows (“the sandbox”) at the top of the raw […]