

Despite conventional wisdom, “the returns on more volatile equities have not exceeded the historical returns on less volatile equities,” said Grant Wang, Senior Vice-President and Head of Research at Highstreet Asset Management in London, Canada. He was the first of two speakers at the GARP Toronto Chapter meeting held at First Canadian Place at King & Bay, Toronto on the evening of January 30, 2014.
Wang began with a brief survey of the increased volatility in equity markets over the past several years: the 2001 tech bubble, the 2008 housing crash, and the 2011 European debt crisis.
“VIX has posed a big challenge to equity managers,” Wang said, referring to the stock volatility index nicknamed the fear index. “We are now seeing low returns when people take high risk.” He showed the average returns on the Toronto Stock Exchange (TSX) for high-volatility and low-volatility stocks. “The challenge is how to exploit the opportunity” presented by the low-volatility anomaly.
Wang went on to describe an equity portfolio “with market-like returns” that also had downside protection. This involved building a low-volatility portfolio. He contrasted two methods of evaluating low volatility: through ranking the one-year standard deviation of daily returns of many stocks; or through a minimum variance approach (MVP) that uses factor models and quadratic solvers to choose a minimize variance portfolio.
The statistical factor model used at Highstreet determines the covariance matrix of systematic risks, and the covariance matrix for idiosyncratic risks. “We need careful design to overcome the curse of dimensionality,” he said, noting that ordinary methods with matrices all scale as N X N where N is the number of assets.
 Prior to joining Highstreet in 2012, Wang worked for several years as lead quantitative researcher for one of Canada’s largest pension funds. He thus has strong academic and industry experience in developing predictive statistical models. His group has built a statistical factor model that relies on high-quality returns data only. It is highly responsive to the latest market dynamics.
Wang noted his model had allowed for specification of different portfolio constraints such as: long only, maximum weight 5 percent, industry no more than 10 percent of relative market index, and no less than 70 percent in large-cap.
Wang showed a graph of market-like sector exposure for the low-volatility stocks in ten sectors. For Canadian equities, the rolling 24-month volatility hovered in 10 to 15 percent territory, except for 2009, when it jumped to a high of 23 percent.
“The low-vol equities have higher risk-adjusted returns in all periods,” said Wang. He looked at annual returns through back-testing, and found the Sharpe ratios were better for low-vol, as well as the risk-adjusted return on capital (RAROC).
In closing, Wang urged members to have clients consider a low-volatility strategy. “It gives reduced risk and strong downside protection for an equity portfolio of market-like returns.” ª
Click here to read a summary of the second presentation. ª
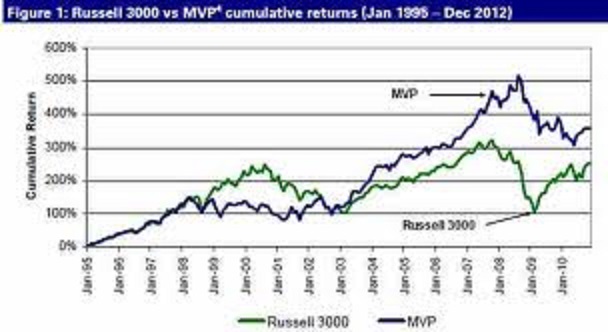
Please note the graphic provided here was not part of Dr. Wang’s presentation; it is a generic illustration.