

Investors realize something must be done to mitigate global warming. The financial system needs reliable tools, or performance indicators, that can measure how well financial portfolios align with the Paris Agreement goals. But what, exactly, are these indicators?
On April 26, 2022, two specialists described the technical side of measuring portfolio alignment with current efforts to combat climate change. The webinar was sponsored by the Global Association of Risk Professionals (GARP) and was moderated by Jo Paisley, President, GARP Risk Institute.
The movement toward portfolio alignment tools (PAT) is an outgrowth from the 26th United Nations Climate Change conference, commonly referred to as COP 26, in Glasgow, Scotland, held in November 2021.
“Measuring ‘financed emissions’ tells you where you are,” said Daniel Stephens, “but tells you nothing about how those emissions must change in order to have a particular climate impact.” Stephens is the Global co-head of Climate and ESG Finance Practice at McKinsey & Company.
Looking at a graph of emissions over time, he said it’s not enough just to know the point-in-time measurement. “It’s all about the slope of the curve and the area under the curve.”
Point-in-time, the simplest form of measurement, can lead to spurious results. “Measuring ‘financed emissions’ can conflate portfolio growth with actual growth in real-world emissions,” he noted.
Because ‘financed emissions’ focuses on present-day performance, relying on them can encourage divestment from companies that have high absolute emissions today, but that may be decarbonizing appropriately.
The central idea: “To finance those emitters who are quickly reducing emissions,” i.e., the slope of the curve.
Carter Powis, the second panelist, tried to describe PAT. Carter Powis is a Senior Adviser at McKinsey & Company and his work is focused on climate change and sustainability. He is also currently conducting research on climate dynamics at the University of Oxford.
The newest form of PAT belongs to the type called implied temperature rise (ITR) or degree-warming models. The PAT approach is meant to “solve three big financed-emissions accounting problems,” Powis said. For example, “if I divest from a company, I haven’t actually reduced emissions in the real world, but it will appear so.”
PAT is “based on forward-looking scenarios”: the tools evaluate companies based on their current emissions in the context of what must be done to achieve a given climate goal.
He explained that PAT builds a portfolio-level benchmark by aggregating individual counterparty benchmarks. “If a new company is added to the portfolio, the benchmark and portfolio emissions must also increase,” eliminating the penalty for portfolio growth, as long as the new companies are decarbonizing at the appropriate rate.
“Everyone decarbonizes at a different rate,” Powis said. For example, a power utility in India might have to decarbonize more slowly than its U.S. counterpart.
Furthermore, the PAT approach means the effects of industry sector and geography on portfolio climate performance are taken into account. “Individual counterparty benchmarks are built using unique sector and geography targets. The impact of including a given company is based on its performance over time.”
Powis described three design issues that surfaced when the Task Force on Climate-Related Financial Disclosures (TCFD) commissioned the COP26 Portfolio Alignment Team to produce a technical report on PAT. The team was spearheaded by Mark Carney, the UN Special Envoy for Climate Action and Finance.
As far as methodology, the devil is in the details. “The report is lengthy and technical, with 26 recommendations, 19 of which apply to PAT,” Powis said.
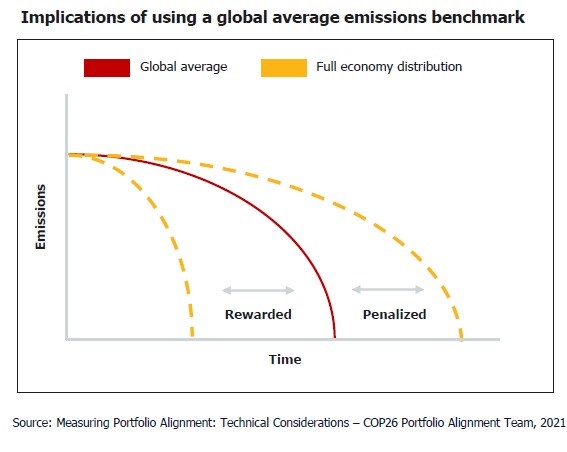
The team felt that “granular benchmarks should be prioritized.” This graph shows the implications of using a global average emissions benchmark.
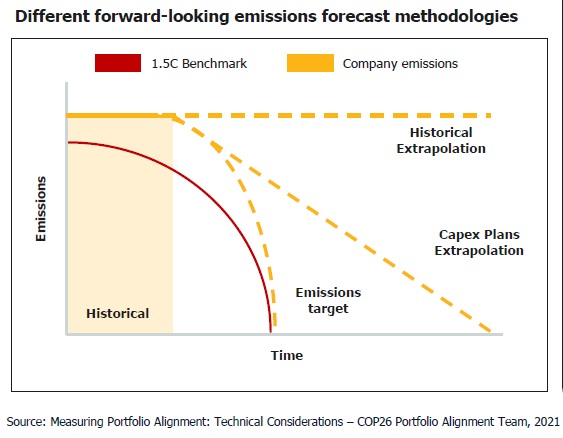
Another thing the team recommended is to use a “blended forecast that makes use of targets, historical emissions trajectory, and extrapolation from declared capex.”
“Most Cap Ex are in a five-year time frame,” Jo Paisley said. “How do you extrapolate to 2050?”
Powis said that figuring out how to blend timelines was a “top priority” for the PAT group.
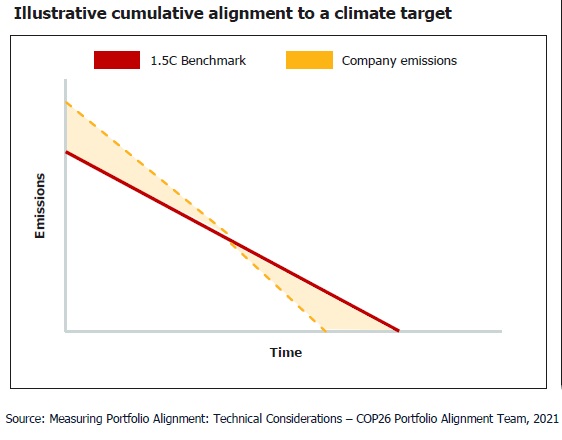
The third design recommendation of the team is that “emissions assessments need to be conducted in cumulative terms to be scientifically valid.”
“You can’t just look at point in time,” Powis said, “you must consider the area under the curve, because emissions are constantly accumulating.”
When it comes to portfolio alignment, much work remains to be done on making the methodology consistent. The two specialists concluded by urging the audience to read the technical report [see link below]. Paisley recommended the audience to also check out the resources at GARP for understanding sustainability and climate change. ♠️
Click here to access the technical report on portfolio alignment tools for climate change.
Click here to read our blog posting about COP26 (November 2021).
Click here to view the one-hour webinar featuring Jo Paisley, Daniel Stephens, and Carter Powis.