

The team of Scott L. Smith, Jesse Weiher, and Debra Fuller at the Federal Housing Finance Agency (FHFA) use specialized financial models to estimate potential losses. They carried out empirical tests of countercyclical shocks using four different models of mortgage credit risk. This posting continues a February 4, 2015, presentation by Scott L. Smith to an audience of financial risk managers at Global Association of Risk Professionals (GARP).
Two models were devised at FHFA, and two are commercially available credit models: one, called Black Knight (formerly LPS-AA), and the other called ADCO Loan Dynamics. The estimated losses were converted to a capital requirement. Each state had differing depths of shock, and there were different combinations of loan-to-value (LTV) and FICO parameters.
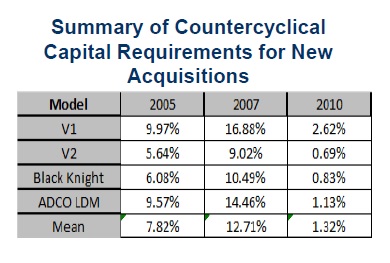
All four models gave countercyclical results, which confirmed the assumptions regarding troughs and trend lines. As well, all four models agreed that 2007 was the worst year, with the highest capital requirement occurring then.
Smith said he was surprised by the differences between the two FHFA models, V1 and V2, which differed by a factor of two in predicted capital requirements. Figure 3 is a table summarizing the results; even the two commercial models vary significantly.
Smith presented tables of loss estimates (year of origination of mortgage versus simulated start year for prepayment) for three models. One goal of a good model is that assets were fully capitalized at the point of acquisition (thus, not need to be topped up, even in a poor economic climate). After the first year of the mortgage, the capital requirement never exceeded 100 percent. In other words, he said, “you hope you have enough capital on day one to carry the capital requirement through the lifetime of the loan.”
Noting that the models varied widely in loss estimate results, Smith said, “we recommend [a bank] release only 50 percent of what any capital model shows.” It is a conservative rule for release of capital, he admitted, but was prudent given the wide variation in models.
“How well would the methodology have worked if it had been in place during the recent credit crisis?” he asked. Smith reported the FHFA V2 model resulted in $139 billion stressed capital—compared to an actual loss of $122 billion by Fannie Mae. At the state level, the model “works pretty well.”
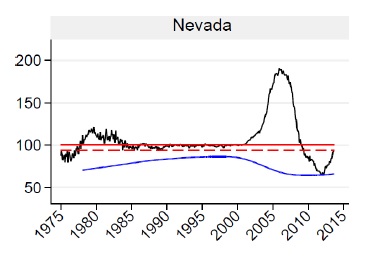
They compared actual versus theoretical trough design, and found that, in the most recent downturn, there were “11 states that established new troughs” with Nevada, Michigan, and Georgia leading the pack.
“House price asymmetry was observed in nearly every state,” Smith said. The asymmetry refers to the peaks lying further above the trend line than troughs lying below it.
Nevada was the focus of a test of new methodology. Figure 4 contrasts the old methodology for ordinary trend lines (red solid line) and stressed (red broken line) against the new methodology (blue line). The variance due to the recent crisis would have been missed by models using the old methodology, whereas “we see that coming years in advance,” he said.
He concluded that, overall, the dynamic rules-based design for mortgage credit risk is robust and has predictive value.ª
Go to Part 1, which describes the first half of the presentation.
All figures shown are used from the webinar presentation with permission from the authors.